- Page 1:
Electrical Geodesics, Inc. Net Stat
- Page 4 and 5:
Electrical Geodesics makes no warra
- Page 6 and 7:
vi Contents chapter 3 chapter 4 cha
- Page 8 and 9:
viii Contents chapter 18 chapter 19
- Page 10 and 11:
List of Figures chapter 5 Averaging
- Page 12 and 13:
List of Figures 17-16 Temporal rela
- Page 14 and 15:
List of Figures xiv Net Station Wav
- Page 16 and 17:
List of Tables chapter 17 Segmentat
- Page 18 and 19:
Preface • The Net Station Viewer
- Page 20 and 21:
Preface Troubleshooting, Support, a
- Page 22 and 23:
1: The Waveform Tools Window Table
- Page 24 and 25:
1: The Waveform Tools Window Creati
- Page 26 and 27:
1: The Waveform Tools Window • To
- Page 28 and 29:
1: The Waveform Tools Window Tips o
- Page 30 and 31:
1: The Waveform Tools Window In an
- Page 32 and 33:
1: The Waveform Tools Window File M
- Page 34 and 35:
1: The Waveform Tools Window Docs M
- Page 36 and 37:
1: The Waveform Tools Window 36 Net
- Page 38 and 39:
2: Jobs and Results Window Jobs and
- Page 40 and 41:
2: Jobs and Results Window Results
- Page 42 and 43:
2: Jobs and Results Window 42 Net S
- Page 44 and 45:
3: Common Controls 2. Output Option
- Page 46 and 47:
3: Common Controls Table 3-2. Outpu
- Page 48 and 49:
3: Common Controls • Category lis
- Page 50 and 51:
4: Artifact Detection Threshold Art
- Page 52 and 53:
4: Artifact Detection The tool can
- Page 54 and 55:
4: Artifact Detection Eye Movements
- Page 56 and 57:
4: Artifact Detection 2. “Perform
- Page 58 and 59:
4: Artifact Detection 3. “Output
- Page 60 and 61:
4: Artifact Detection Eye-Blink Thr
- Page 62 and 63:
4: Artifact Detection Data Pane: Se
- Page 64 and 65:
4: Artifact Detection 64 Net Statio
- Page 66 and 67:
5: Averaging Averaging Specificatio
- Page 68 and 69:
5: Averaging 5. Exclude Subjects an
- Page 70 and 71:
6: Bad Channel Replacement For more
- Page 72 and 73:
6: Bad Channel Replacement 72 Net S
- Page 74 and 75:
7: Baseline Correction The followin
- Page 76 and 77:
7: Baseline Correction 76 Net Stati
- Page 78 and 79:
8: Combine Files Combine Files Spec
- Page 80 and 81:
8: Combine Files Stacking Files Sta
- Page 82 and 83:
8: Combine Files Merge Just the Sel
- Page 84 and 85:
8: Combine Files 2. Carry Selected
- Page 86 and 87:
9: Difference Wave You can choose f
- Page 88 and 89:
9: Difference Wave 88 Net Station W
- Page 90 and 91:
10: Event Export The spreadsheet co
- Page 92 and 93:
10: Event Export 92 Net Station Wav
- Page 94 and 95:
11: File Export The File Export spe
- Page 96 and 97:
11: File Export 96 Net Station Wave
- Page 98 and 99:
12: Filtering • Stopband gain: co
- Page 100 and 101:
12: Filtering Filtering Specificati
- Page 102 and 103:
12: Filtering Filter Settings Pane
- Page 104 and 105:
13: Markup from File Event File For
- Page 106 and 107:
13: Markup from File Marking Channe
- Page 108 and 109:
13: Markup from File Net Station EE
- Page 110 and 111:
Net Station EEG file with mark-up e
- Page 112 and 113:
13: Markup from File Net Station EE
- Page 114 and 115:
13: Markup from File 2. Track Name.
- Page 116 and 117:
14: Montage Operations There are se
- Page 118 and 119:
14: Montage Operations 2. Montage l
- Page 120 and 121:
15: Ocular Artifact Removal The OAR
- Page 122 and 123:
15: Ocular Artifact Removal Table 1
- Page 124 and 125:
15: Ocular Artifact Removal 124 Net
- Page 126 and 127: 16: Script be detected only at run
- Page 128 and 129: 16: Script 128 Net Station Waveform
- Page 130 and 131: 17: Segmentation Segmentation Overv
- Page 132 and 133: 17: Segmentation Segmentation Proce
- Page 134 and 135: 17: Segmentation 5 A category can c
- Page 136 and 137: 17: Segmentation Figure 17-8 shows
- Page 138 and 139: 17: Segmentation Double-Checking Yo
- Page 140 and 141: 17: Segmentation 2. Criteria pane.
- Page 142 and 143: 17: Segmentation Table 17-4. Criter
- Page 144 and 145: 17: Segmentation Criteria Sets Pane
- Page 146 and 147: 17: Segmentation The following are
- Page 148 and 149: 17: Segmentation Temporal Relations
- Page 150 and 151: 17: Segmentation Table 17-8. Criter
- Page 152 and 153: 17: Segmentation Temporal Relations
- Page 154 and 155: 17: Segmentation • Beyond: specif
- Page 156 and 157: 17: Segmentation • Generate Event
- Page 158 and 159: 17: Segmentation We base the segmen
- Page 160 and 161: 17: Segmentation Example 2: Advance
- Page 162 and 163: 17: Segmentation Criteria Set 1 Cri
- Page 164 and 165: 17: Segmentation 164 Net Station Wa
- Page 166 and 167: 18: Short Epoch Filtering FIR versu
- Page 168 and 169: 18: Short Epoch Filtering The follo
- Page 170 and 171: 19: Statistic Extraction You specif
- Page 172 and 173: 19: Statistic Extraction 2. Add/Clo
- Page 174 and 175: 19: Statistic Extraction Note: By
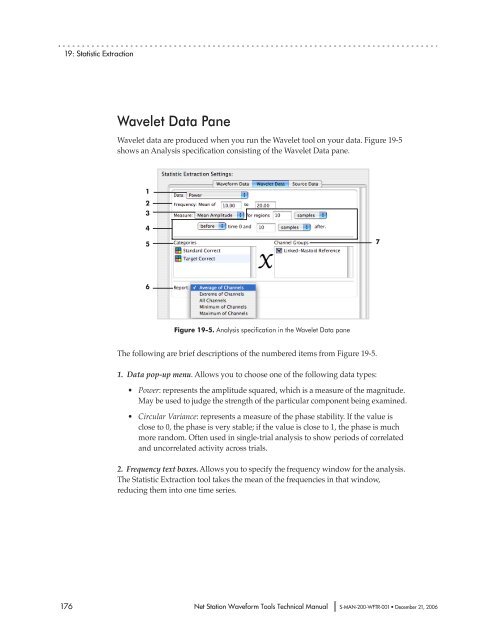
- Page 178 and 179: 19: Statistic Extraction • Maximu
- Page 180 and 181: 19: Statistic Extraction Note: If t
- Page 182 and 183: 19: Statistic Extraction Note: For
- Page 184 and 185: 20: T-test T-test Waveform Tool The
- Page 186 and 187: 20: T-test The two-cell t-test woul
- Page 188 and 189: 20: T-test The results are output t
- Page 190 and 191: 20: T-test 190 Net Station Waveform
- Page 192 and 193: 21: Wavelet In wavelet transformati
- Page 194 and 195: 21: Wavelet The top images show a w
- Page 196 and 197: 21: Wavelet Net Station’s Values
- Page 198 and 199: 21: Wavelet 3. “Frequency scale f
- Page 200 and 201: 21: Wavelet before or after the eve
- Page 202 and 203: A: Software Technical Support 202 N
- Page 204 and 205: B: Updating EGI Licenses Tips on Up
- Page 206 and 207: B: Updating EGI Licenses Generating
- Page 208 and 209: B: Updating EGI Licenses Questions
- Page 210 and 211: Index E Edit menu 33 editing specif
- Page 212: Index Statistic Extraction specific


