Net Station Waveform Tools - College of Education & Human ...
Net Station Waveform Tools - College of Education & Human ...
Net Station Waveform Tools - College of Education & Human ...

You also want an ePaper? Increase the reach of your titles
YUMPU automatically turns print PDFs into web optimized ePapers that Google loves.
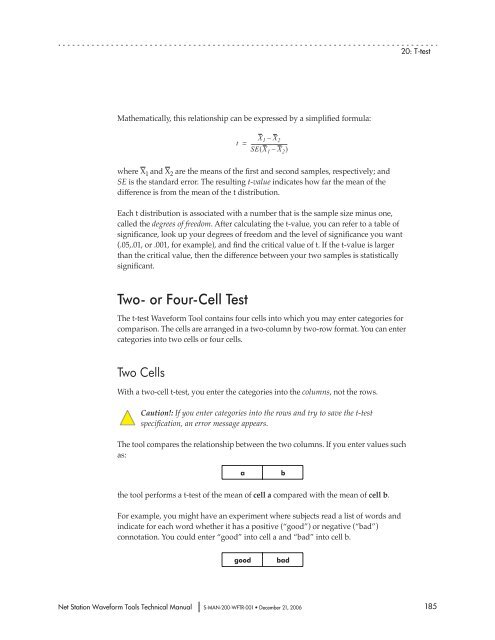
Mathematically, this relationship can be expressed by a simplified formula:<br />
where X 1 and X 2 are the means <strong>of</strong> the first and second samples, respectively; and<br />
SE is the standard error. The resulting t-value indicates how far the mean <strong>of</strong> the<br />
difference is from the mean <strong>of</strong> the t distribution.<br />
Each t distribution is associated with a number that is the sample size minus one,<br />
called the degrees <strong>of</strong> freedom. After calculating the t-value, you can refer to a table <strong>of</strong><br />
significance, look up your degrees <strong>of</strong> freedom and the level <strong>of</strong> significance you want<br />
(.05,.01, or .001, for example), and find the critical value <strong>of</strong> t. If the t-value is larger<br />
than the critical value, then the difference between your two samples is statistically<br />
significant.<br />
Two- or Four-Cell Test<br />
The t-test <strong>Waveform</strong> Tool contains four cells into which you may enter categories for<br />
comparison. The cells are arranged in a two-column by two-row format. You can enter<br />
categories into two cells or four cells.<br />
Two Cells<br />
X1 – X2 t =<br />
-----------------------------<br />
SE( X1 – X2) With a two-cell t-test, you enter the categories into the columns, not the rows.<br />
Caution!: If you enter categories into the rows and try to save the t-test<br />
specification, an error message appears.<br />
The tool compares the relationship between the two columns. If you enter values such<br />
as:<br />
a b<br />
the tool performs a t-test <strong>of</strong> the mean <strong>of</strong> cell a compared with the mean <strong>of</strong> cell b.<br />
For example, you might have an experiment where subjects read a list <strong>of</strong> words and<br />
indicate for each word whether it has a positive (“good”) or negative (“bad”)<br />
connotation. You could enter “good” into cell a and “bad” into cell b.<br />
good bad<br />
<strong>Net</strong> <strong>Station</strong> <strong>Waveform</strong> <strong>Tools</strong> Technical Manual S-MAN-200-WFTR-001 • December 21, 2006<br />
20: T-test<br />
185