

AH ANNUAL REPORT 2018

You also want an ePaper? Increase the reach of your titles
YUMPU automatically turns print PDFs into web optimized ePapers that Google loves.
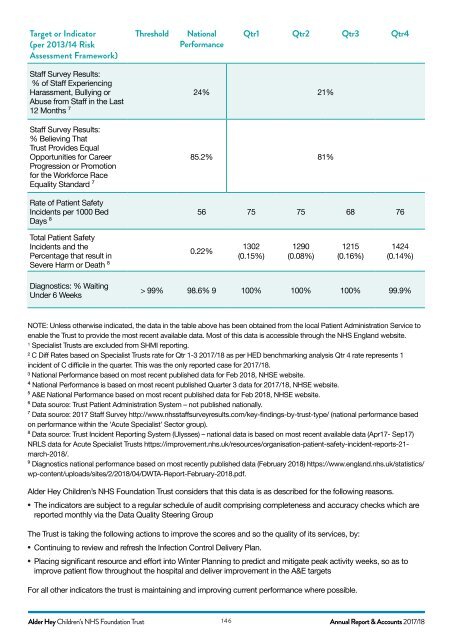
Target or Indicator<br />
(per 2013/14 Risk<br />
Assessment Framework)<br />
Threshold<br />
National<br />
Performance<br />
Qtr1 Qtr2 Qtr3 Qtr4<br />
Staff Survey Results:<br />
% of Staff Experiencing<br />
Harassment, Bullying or<br />
Abuse from Staff in the Last<br />
12 Months ⁷<br />
Staff Survey Results:<br />
% Believing That<br />
Trust Provides Equal<br />
Opportunities for Career<br />
Progression or Promotion<br />
for the Workforce Race<br />
Equality Standard ⁷<br />
Rate of Patient Safety<br />
Incidents per 1000 Bed<br />
Days ⁸<br />
24% 21%<br />
85.2% 81%<br />
56 75 75 68 76<br />
Total Patient Safety<br />
Incidents and the<br />
Percentage that result in<br />
Severe Harm or Death ⁸<br />
0.22%<br />
1302<br />
(0.15%)<br />
1290<br />
(0.08%)<br />
1215<br />
(0.16%)<br />
1424<br />
(0.14%)<br />
Diagnostics: % Waiting<br />
Under 6 Weeks<br />
> 99% 98.6% 9 100% 100% 100% 99.9%<br />
NOTE: Unless otherwise indicated, the data in the table above has been obtained from the local Patient Administration Service to<br />
enable the Trust to provide the most recent available data. Most of this data is accessible through the NHS England website.<br />
¹ Specialist Trusts are excluded from SHMI reporting.<br />
² C Diff Rates based on Specialist Trusts rate for Qtr 1-3 2017/18 as per HED benchmarking analysis Qtr 4 rate represents 1<br />
incident of C difficile in the quarter. This was the only reported case for 2017/18.<br />
³ National Performance based on most recent published data for Feb <strong>2018</strong>, NHSE website.<br />
₄ National Performance is based on most recent published Quarter 3 data for 2017/18, NHSE website.<br />
⁵ A&E National Performance based on most recent published data for Feb <strong>2018</strong>, NHSE website.<br />
⁶ Data source: Trust Patient Administration System – not published nationally.<br />
⁷ Data source: 2017 Staff Survey http://www.nhsstaffsurveyresults.com/key-findings-by-trust-type/ (national performance based<br />
on performance within the ‘Acute Specialist’ Sector group).<br />
⁸ Data source: Trust Incident Reporting System (Ulysses) – national data is based on most recent available data (Apr17- Sep17)<br />
NRLS data for Acute Specialist Trusts https://improvement.nhs.uk/resources/organisation-patient-safety-incident-reports-21-<br />
march-<strong>2018</strong>/.<br />
⁹ Diagnostics national performance based on most recently published data (February <strong>2018</strong>) https://www.england.nhs.uk/statistics/<br />
wp-content/uploads/sites/2/<strong>2018</strong>/04/DWTA-Report-February-<strong>2018</strong>.pdf.<br />
Alder Hey Children’s NHS Foundation Trust considers that this data is as described for the following reasons.<br />
• The indicators are subject to a regular schedule of audit comprising completeness and accuracy checks which are<br />
reported monthly via the Data Quality Steering Group<br />
The Trust is taking the following actions to improve the scores and so the quality of its services, by:<br />
• Continuing to review and refresh the Infection Control Delivery Plan.<br />
• Placing significant resource and effort into Winter Planning to predict and mitigate peak activity weeks, so as to<br />
improve patient flow throughout the hospital and deliver improvement in the A&E targets<br />
For all other indicators the trust is maintaining and improving current performance where possible.<br />
Alder Hey Children’s NHS Foundation Trust 146<br />
Annual Report & Accounts 2017/18