In conclusion, although it cannot be demonstrated that resources aimed at SSN funding were effectively underestimated or not, it can be observed that structural deficits have been established since the onset of the SSN. The analysis also demonstrates how the funding trend did not always take into consideration the principal production factors (i.e. the cost of SSN dependent staff); and finally it must be observed that, on the whole, the difference between funding and expenditure has substantially maintained a rather stable and sustainable level over the years. 1.7.3 Regional data: sharing of resources and deficit One of the principal characteristics of the National Health Service in Italy is the adoption of a solidarity standard which has led to a level of different per capita funding for each Region. Table 3 demonstrates the per capita shares allocated to each Region, expressed in terms of index numbers. Table 3 – Per capita funding index numbers Regions 1992 1995 2000 2001 2002 2003 2004 2005 1992/2005 Italy 100 100 100 100 100 100 100 100 Piemonte Valle d'Aosta Lombardia Trentino A.A. Veneto Friuli V.G. Liguria Emilia Romagna Toscana Umbria Marche Lazio Abruzzo Molise Campania Puglia Basilicata Calabria Sicilia Sardegna Diff. between max. and min. values Source: our elaboration Ministry of Health and ISTAT data 97,7 101,3 104,5 105,0 104,1 104,0 105,1 107,8 10,1 99,5 107,1 123,3 105,1 122,7 120,0 120,0 121,4 21,9 100,2 103,0 101,5 99,1 99,3 98,2 98,0 99,3 -0,9 98,7 115,4 125,5 102,4 122,6 127,3 127,2 123,7 25,0 101,7 104,9 102,9 100,0 99,1 99,3 102,4 100,6 -1,1 105,4 106,5 106,2 104,5 106,1 104,8 108,4 107,2 1,8 111,8 108,6 115,4 114,2 112,6 111,8 112,3 109,2 -2,6 110,8 109,5 110,5 106,9 105,5 104,7 103,1 106,4 -4,4 103,0 103,0 105,7 106,3 104,9 104,5 103,8 104,9 1,9 103,7 108,2 108,8 105,2 103,6 103,1 102,7 102,8 -0,9 106,9 102,7 115,4 100,8 100,3 99,6 99,3 101,1 -5,8 102,9 98,2 100,4 98,5 99,9 102,4 102,9 99,6 -3,3 95,7 98,4 99,6 100,4 99,0 98,2 96,7 98,8 3,1 95,8 95,2 98,5 102,6 100,7 100,3 99,9 103,1 7,3 96,1 92,2 88,6 93,6 93,6 93,7 91,9 89,9 -6,2 95,1 94,9 91,2 94,2 95,3 95,7 95,6 93,5 -1,6 87,6 91,0 88,0 96,9 97,4 96,8 97,7 97,1 9,5 91,4 90,8 88,9 96,4 95,6 96,8 95,5 94,9 3,5 95,6 91,6 89,8 95,5 94,7 94,8 94,3 95,9 0,3 94,9 95,1 91,3 98,3 95,1 95,3 94,0 94,4 -0,5 24,1 24,6 37,5 20,6 29,1 33,6 35,3 33,8 9,7 [109] CEIS Health Report 2006 diff.
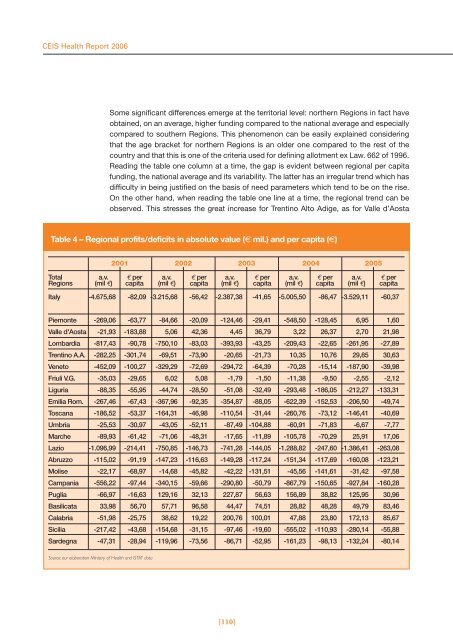
CEIS Health Report 2006 Some significant differences emerge at the territorial level: northern Regions in fact have obtained, on an average, higher funding compared to the national average and especially compared to southern Regions. This phenomenon can be easily explained considering that the age bracket for northern Regions is an older one compared to the rest of the country and that this is one of the criteria used for defining allotment ex Law. 662 of 1996. Reading the table one column at a time, the gap is evident between regional per capita funding, the national average and its variability. The latter has an irregular trend which has difficulty in being justified on the basis of need parameters which tend to be on the rise. On the other hand, when reading the table one line at a time, the regional trend can be observed. This stresses the great increase for Trentino Alto Adige, as for Valle d’Aosta Table 4 – Regional profits/deficits in absolute value (€ mil.) and per capita (€) 2001 2002 2003 2004 2005 Total a.v. € per a.v. € per a.v. € per a.v. € per a.v. € per Regions (mil €) capita (mil €) capita (mil €) capita (mil €) capita (mil €) capita Italy -4.675,68 -82,09 -3.215,68 -56,42 -2.387,38 -41,65 -5.005,50 -86,47 -3.529,11 -60,37 Piemonte -269,06 -63,77 -84,66 -20,09 -124,46 -29,41 -548,50 -128,45 6,95 1,60 Valle d'Aosta -21,93 -183,88 5,06 42,36 4,45 36,79 3,22 26,37 2,70 21,98 Lombardia -817,43 -90,78 -750,10 -83,03 -393,93 -43,25 -209,43 -22,65 -261,95 -27,89 Trentino A.A. -282,25 -301,74 -69,51 -73,90 -20,65 -21,73 10,35 10,76 29,85 30,63 Veneto -452,09 -100,27 -329,29 -72,69 -294,72 -64,39 -70,28 -15,14 -187,90 -39,98 Friuli V.G. -35,03 -29,65 6,02 5,08 -1,79 -1,50 -11,38 -9,50 -2,55 -2,12 Liguria -88,35 -55,95 -44,74 -28,50 -51,08 -32,49 -293,48 -186,05 -212,27 -133,31 Emilia Rom. -267,46 -67,43 -367,96 -92,35 -354,87 -88,05 -622,39 -152,53 -206,50 -49,74 Toscana -186,52 -53,37 -164,31 -46,98 -110,54 -31,44 -260,76 -73,12 -146,41 -40,69 Umbria -25,53 -30,97 -43,05 -52,11 -87,49 -104,88 -60,91 -71,83 -6,67 -7,77 Marche -89,93 -61,42 -71,06 -48,31 -17,65 -11,89 -105,78 -70,29 25,91 17,06 Lazio -1.096,99 -214,41 -750,85 -146,73 -741,28 -144,05 -1.288,82 -247,60 -1.386,41 -263,08 Abruzzo -115,02 -91,19 -147,23 -116,63 -149,28 -117,24 -151,34 -117,69 -160,08 -123,21 Molise -22,17 -68,97 -14,68 -45,82 -42,22 -131,51 -45,56 -141,61 -31,42 -97,58 Campania -556,22 -97,44 -340,15 -59,66 -290,80 -50,79 -867,79 -150,65 -927,84 -160,28 Puglia -66,97 -16,63 129,16 32,13 227,87 56,63 156,89 38,82 125,95 30,96 Basilicata 33,98 56,70 57,71 96,58 44,47 74,51 28,82 48,28 49,79 83,46 Calabria -51,98 -25,75 38,62 19,22 200,76 100,01 47,88 23,80 172,13 85,67 Sicilia -217,42 -43,68 -154,68 -31,15 -97,46 -19,60 -555,02 -110,93 -280,14 -55,88 Sardegna -47,31 -28,94 -119,96 -73,56 -86,71 -52,95 -161,23 -98,13 -132,24 -80,14 Source: our elaboration Ministry of Health and ISTAT data [110]
- Page 1 and 2:
CEIS Health Report 2006 Management
- Page 3 and 4:
CEIS Health Report 2006 Management
- Page 6 and 7:
Index Report Presentation by Pagane
- Page 8 and 9:
1.6 - The Regional Primary Care Agr
- Page 10 and 11:
Chapter 3 - Efficiency 3.1 - The Ef
- Page 12 and 13:
3.8 - Private Health Insurance and
- Page 14:
Ceis - Sanità Report presentation
- Page 17 and 18:
Warning The figures in the volume f
- Page 19 and 20:
CEIS Health Report 2006 stantial, i
- Page 21 and 22:
CEIS Health Report 2006 If, therefo
- Page 23 and 24:
CEIS Health Report 2006 Cross-check
- Page 25 and 26:
CEIS Health Report 2006 over € 6.
- Page 27 and 28:
CEIS Health Report 2006 made; final
- Page 29 and 30:
CEIS Health Report 2006 Although th
- Page 31 and 32:
CEIS Health Report 2006 Aside from
- Page 33 and 34:
CEIS Health Report 2006 Regulations
- Page 35 and 36:
CEIS Health Report 2006 especially
- Page 38:
Chapter 1 Health expenditure and fu
- Page 41 and 42:
CEIS Health Report 2006 The questio
- Page 43 and 44:
CEIS Health Report 2006 Table 1 - T
- Page 45 and 46:
CEIS Health Report 2006 Figure 3 -
- Page 47 and 48:
CEIS Health Report 2006 Figure 6 -
- Page 49 and 50:
CEIS Health Report 2006 Figure 8 -
- Page 51 and 52:
CEIS Health Report 2006 Figure 10 -
- Page 53 and 54:
CEIS Health Report 2006 ciated with
- Page 55 and 56:
CEIS Health Report 2006 ● OECD (2
- Page 57 and 58: CEIS Health Report 2006 Figure 2 -
- Page 59 and 60: CEIS Health Report 2006 the phenome
- Page 61 and 62: CEIS Health Report 2006 Table 3 - R
- Page 63 and 64: CEIS Health Report 2006 The indicat
- Page 65 and 66: CEIS Health Report 2006 References
- Page 67 and 68: CEIS Health Report 2006 All the var
- Page 69 and 70: CEIS Health Report 2006 Diagram 1 -
- Page 71 and 72: CEIS Health Report 2006 1.4 - Pharm
- Page 73 and 74: CEIS Health Report 2006 % Pharmaceu
- Page 75 and 76: CEIS Health Report 2006 The second
- Page 77 and 78: CEIS Health Report 2006 tion of res
- Page 79 and 80: CEIS Health Report 2006 Table 4 - R
- Page 81 and 82: CEIS Health Report 2006 The variati
- Page 83 and 84: CEIS Health Report 2006 1.5 - The r
- Page 85 and 86: CEIS Health Report 2006 Figure 2 -
- Page 87 and 88: CEIS Health Report 2006 southern Re
- Page 89 and 90: CEIS Health Report 2006 1.5.5 Absor
- Page 91 and 92: CEIS Health Report 2006 For day hos
- Page 93 and 94: CEIS Health Report 2006 There is co
- Page 95 and 96: CEIS Health Report 2006 1.6 - The r
- Page 97 and 98: CEIS Health Report 2006 the Primary
- Page 99 and 100: CEIS Health Report 2006 Table 1 - T
- Page 101 and 102: CEIS Health Report 2006 • “phys
- Page 103 and 104: CEIS Health Report 2006 1.7 - Evolu
- Page 105 and 106: CEIS Health Report 2006 As can be o
- Page 107: CEIS Health Report 2006 Another int
- Page 111 and 112: CEIS Health Report 2006 1.7.5 Concl
- Page 113 and 114: CEIS Health Report 2006 [114]
- Page 116: Introduction Public deficit in the
- Page 119 and 120: CEIS Health Report 2006 The cumulat
- Page 121 and 122: CEIS Health Report 2006 tegies of i
- Page 123 and 124: CEIS Health Report 2006 gest that t
- Page 125 and 126: CEIS Health Report 2006 increase of
- Page 127 and 128: CEIS Health Report 2006 increase in
- Page 129 and 130: CEIS Health Report 2006 [130]
- Page 131 and 132: CEIS Health Report 2006 It is also
- Page 133 and 134: CEIS Health Report 2006 shifting be
- Page 135 and 136: CEIS Health Report 2006 year (AIHW
- Page 137 and 138: CEIS Health Report 2006 cost of the
- Page 139 and 140: CEIS Health Report 2006 The Second
- Page 141 and 142: CEIS Health Report 2006 2.5 - Imple
- Page 143 and 144: CEIS Health Report 2006 2.5.3 Shift
- Page 145 and 146: CEIS Health Report 2006 Table 1 - P
- Page 147 and 148: CEIS Health Report 2006 and, conseq
- Page 149 and 150: CEIS Health Report 2006 Grant whose
- Page 151 and 152: CEIS Health Report 2006 Generally s
- Page 153 and 154: CEIS Health Report 2006 Scheme for
- Page 156 and 157: 3.1 - The efficiency of Regional He
- Page 158 and 159:
Table 2 - LEA Financing REGIONS HOS
- Page 160 and 161:
• Campania, with strong financial
- Page 162 and 163:
[163] CEIS Health Report 2006
- Page 164 and 165:
hospital stays has reduced the aver
- Page 166 and 167:
treated varies greatly. The highest
- Page 168 and 169:
CMS = f(COST, CMP, PL, RC, DM , PME
- Page 170 and 171:
formance, implying an increase in a
- Page 172 and 173:
3.3 - The National Health System Ev
- Page 174 and 175:
3.3.3 Cooperation with the Regional
- Page 176 and 177:
the contract conditions are previou
- Page 178 and 179:
Consequentially, in order to avoid
- Page 180 and 181:
order through the MEPA) numbered 14
- Page 182 and 183:
3.4 - Strengthening the capacity fo
- Page 184 and 185:
for designing and governing organiz
- Page 186 and 187:
the hierarchical and management rol
- Page 188 and 189:
tions may appear and disappear, the
- Page 190 and 191:
lop, rather than a variable to be c
- Page 192 and 193:
units along business lines were unq
- Page 194 and 195:
cooperation to achieve the developm
- Page 196 and 197:
However, to manage a multi-site hos
- Page 198 and 199:
Figure 2 - AVS Strategy map • con
- Page 200 and 201:
cialties, but what sets them apart,
- Page 202 and 203:
nistically or quantitatively. Hence
- Page 204 and 205:
portant for healthcare industry, as
- Page 206 and 207:
tor is that General Managers usuall
- Page 208 and 209:
cation of the ABC and, in general,
- Page 210 and 211:
● Kaplan R, Norton D (1992), “T
- Page 212 and 213:
3.7 - The management of healthcare
- Page 214 and 215:
Table 1 - Pathway for st elevated a
- Page 216 and 217:
[217] CEIS Health Report 2006 Table
- Page 218 and 219:
Vaginal childbirth Some synthesis i
- Page 220 and 221:
Politiche sanitarie, marzo-aprile.
- Page 222 and 223:
dental work, the purchase or rental
- Page 224 and 225:
2. We might suppose that the state
- Page 226:
● OECD (2004), “Towards High -
- Page 230 and 231:
4.1 - Equity in the italian healthc
- Page 232 and 233:
Table 2 - Association indexes betwe
- Page 234 and 235:
4.1.5 Structure of health expenditu
- Page 236 and 237:
Table 9 - Regional distribution of
- Page 238 and 239:
strophic payments; moreover, the se
- Page 240:
● Doglia M, Spandonaro F, “Il p
- Page 243 and 244:
CEIS Health Report 2006 (i represen
- Page 245 and 246:
CEIS Health Report 2006 sence of di
- Page 247 and 248:
CEIS Health Report 2006 -0,0030, wh
- Page 249 and 250:
CEIS Health Report 2006 Although co
- Page 252 and 253:
5.1 - The median age at death for m
- Page 254 and 255:
causes and the median age at genera
- Page 256 and 257:
in the South and Islands, not only
- Page 258 and 259:
5.2 - Analysis of avoidable deaths
- Page 260 and 261:
population of Italian citizens acco
- Page 262 and 263:
We wish to underline the mortality
- Page 264 and 265:
Diagram 4 - % composition of years
- Page 266 and 267:
5.2.4 Comments The results of the a
- Page 268 and 269:
among whites and blacks,1979-1989
- Page 270 and 271:
Figure 1 - Division % of the quota
- Page 272 and 273:
Figure 3 - Pharmaceutics expenditur
- Page 274 and 275:
Table 3 - Gross fixed investments i
- Page 276 and 277:
Table 4 - Share of medical device w
- Page 278 and 279:
age dimension of enterprises (90 em
- Page 280 and 281:
BOX 2: National Medical Device Clas
- Page 282 and 283:
maceutiche in Italia (1997-2001)”
- Page 284 and 285:
5.4 - Mobility of italian patients
- Page 286 and 287:
Authority (ASL) will be charged for
- Page 288 and 289:
43.950.716,00. At this stage, if yo
- Page 290 and 291:
esting data are certainly provided
- Page 292 and 293:
have carried out economic and stati
- Page 294 and 295:
[295] CEIS Health Report 2006
- Page 296 and 297:
✔ DE POUVOURVILLE GÉRARD Researc
- Page 298 and 299:
✔ MENNINI FRANCESCO SAVERIO Degre
- Page 300:
✔ SCHWEIGER ARTURO Health Economi