Chapter 2
Chapter 2
Chapter 2

You also want an ePaper? Increase the reach of your titles
YUMPU automatically turns print PDFs into web optimized ePapers that Google loves.
CEIS Health Report 2006<br />
The database constructed includes organizations in all 20 Regions 6 , with a total of 77.189<br />
bed places in 2003, with a decrease of 2,73% from the total for the same organizations<br />
in 2002. The number of hospitalizations rose from 3.842.614 in 2002 to 3.781.711 in<br />
2003, while the number of bed-nights fell from 22.865.072 to 21.713.149, a reduction of<br />
5,3%.<br />
Overall, the organizations covered employed 212.167 personnel in 2003, of whom 37.516<br />
doctors and 88.189 nurses.<br />
Their total cost in 2003 amounted to € 14.270 billion, equivalent to € 186.465 per bed<br />
and € 3.741 per hospitalization.<br />
Indicators of activity (bed-fill ratio, mean weight of the DRG, attraction index etc.), of cost<br />
(per day stay in hospital, per hospitalization and mean cost of the personnel) and of the<br />
efficiency of the factors of production (e.g. discharges per doctor, nurses per bed place)<br />
were calculated for each hospital organization.<br />
Focusing on the indicators of cost, we find that between 2002 and 2003 the mean cost<br />
per day of stay rose by 4,5% whereas the cost per unit of personnel remained almost the<br />
same (+ 0,04%).<br />
Obviously, the indicators in question are affected by the different complexities treated<br />
and are not yet suitable for comparisons between organizations.<br />
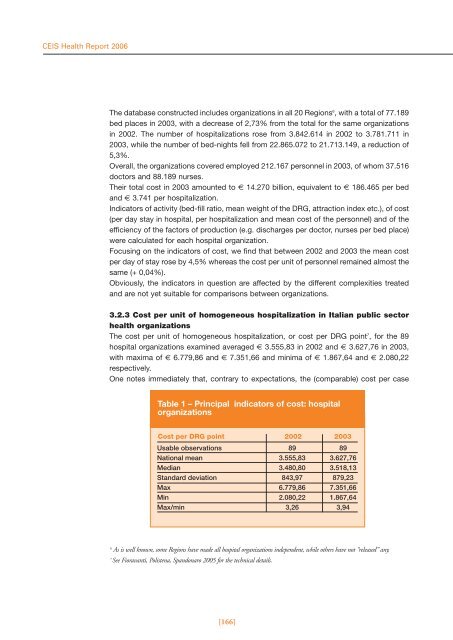
3.2.3 Cost per unit of homogeneous hospitalization in Italian public sector<br />
health organizations<br />
The cost per unit of homogeneous hospitalization, or cost per DRG point 7 , for the 89<br />
hospital organizations examined averaged € 3.555,83 in 2002 and € 3.627,76 in 2003,<br />
with maxima of € 6.779,86 and € 7.351,66 and minima of € 1.867,64 and € 2.080,22<br />
respectively.<br />
One notes immediately that, contrary to expectations, the (comparable) cost per case<br />
Table 1 – Principal indicators of cost: hospital<br />
organizations<br />
Cost per DRG point 2002 2003<br />
Usable observations 89 89<br />
National mean 3.555,83 3.627,76<br />
Median 3.480,80 3.518,13<br />
Standard deviation 843,97 879,23<br />
Max 6.779,86 7.351,66<br />
Min 2.080,22 1.867,64<br />
Max/min 3,26 3,94<br />
6 As is well known, some Regions have made all hospital organizations independent, while others have not “released” any.<br />
7 See Fioravanti, Polistena, Spandonaro 2005 for the technical details.<br />
[166]