Chapter 2
Chapter 2
Chapter 2

You also want an ePaper? Increase the reach of your titles
YUMPU automatically turns print PDFs into web optimized ePapers that Google loves.
have carried out economic and statistic research on patient mobility from their territory,<br />
but the case study of Veneto Region is probably the most outstanding national and<br />
European example of efficiency.<br />
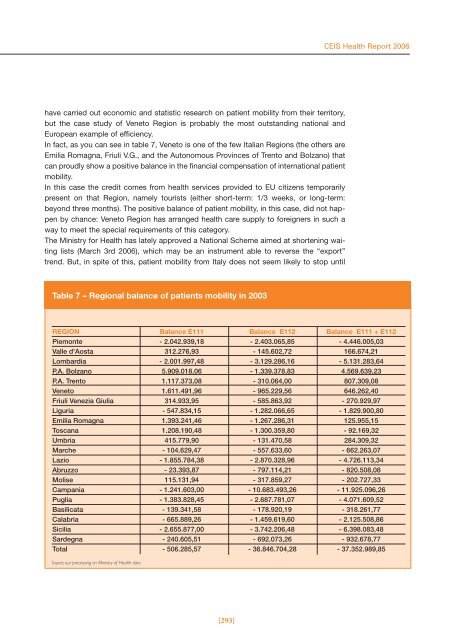
In fact, as you can see in table 7, Veneto is one of the few Italian Regions (the others are<br />
Emilia Romagna, Friuli V.G., and the Autonomous Provinces of Trento and Bolzano) that<br />
can proudly show a positive balance in the financial compensation of international patient<br />
mobility.<br />
In this case the credit comes from health services provided to EU citizens temporarily<br />
present on that Region, namely tourists (either short-term: 1/3 weeks, or long-term:<br />
beyond three months). The positive balance of patient mobility, in this case, did not happen<br />
by chance: Veneto Region has arranged health care supply to foreigners in such a<br />
way to meet the special requirements of this category.<br />
The Ministry for Health has lately approved a National Scheme aimed at shortening waiting<br />
lists (March 3rd 2006), which may be an instrument able to reverse the “export”<br />
trend. But, in spite of this, patient mobility from Italy does not seem likely to stop until<br />
Table 7 – Regional balance of patients mobility in 2003<br />
[293]<br />
CEIS Health Report 2006<br />
REGION Balance E111 Balance E112 Balance E111 + E112<br />
Piemonte - 2.042.939,18 - 2.403.065,85 - 4.446.005,03<br />
Valle d'Aosta 312.276,93 - 145.602,72 166.674,21<br />
Lombardia - 2.001.997,48 - 3.129.286,16 - 5.131.283,64<br />
P.A. Bolzano 5.909.018,06 - 1.339.378,83 4.569.639,23<br />
P.A. Trento 1.117.373,08 - 310.064,00 807.309,08<br />
Veneto 1.611.491,96 - 965.229,56 646.262,40<br />
Friuli Venezia Giulia 314.933,95 - 585.863,92 - 270.929,97<br />
Liguria - 547.834,15 - 1.282.066,65 - 1.829.900,80<br />
Emilia Romagna 1.393.241,46 - 1.267.286,31 125.955,15<br />
Toscana 1.208.190,48 - 1.300.359,80 - 92.169,32<br />
Umbria 415.779,90 - 131.470,58 284.309,32<br />
Marche - 104.629,47 - 557.633,60 - 662.263,07<br />
Lazio - 1.855.784,38 - 2.870.328,96 - 4.726.113,34<br />
Abruzzo - 23.393,87 - 797.114,21 - 820.508,08<br />
Molise 115.131,94 - 317.859,27 - 202.727,33<br />
Campania - 1.241.603,00 - 10.683.493,26 - 11.925.096,26<br />
Puglia - 1.383.828,45 - 2.687.781,07 - 4.071.609,52<br />
Basilicata - 139.341,58 - 178.920,19 - 318.261,77<br />
Calabria - 665.889,26 - 1.459.619,60 - 2.125.508,86<br />
Sicilia - 2.655.877,00 - 3.742.206,48 - 6.398.083,48<br />
Sardegna - 240.605,51 - 692.073,26 - 932.678,77<br />
Total - 506.285,57 - 36.846.704,28 - 37.352.989,85<br />
Source: our processing on Ministry of Health data