- Page 1 and 2:
CEIS Health Report 2006 Management
- Page 3 and 4:
CEIS Health Report 2006 Management
- Page 6 and 7:
Index Report Presentation by Pagane
- Page 8 and 9: 1.6 - The Regional Primary Care Agr
- Page 10 and 11: Chapter 3 - Efficiency 3.1 - The Ef
- Page 12 and 13: 3.8 - Private Health Insurance and
- Page 14: Ceis - Sanità Report presentation
- Page 17 and 18: Warning The figures in the volume f
- Page 19 and 20: CEIS Health Report 2006 stantial, i
- Page 21 and 22: CEIS Health Report 2006 If, therefo
- Page 23 and 24: CEIS Health Report 2006 Cross-check
- Page 25 and 26: CEIS Health Report 2006 over € 6.
- Page 27 and 28: CEIS Health Report 2006 made; final
- Page 29 and 30: CEIS Health Report 2006 Although th
- Page 31 and 32: CEIS Health Report 2006 Aside from
- Page 33 and 34: CEIS Health Report 2006 Regulations
- Page 35 and 36: CEIS Health Report 2006 especially
- Page 38: Chapter 1 Health expenditure and fu
- Page 41 and 42: CEIS Health Report 2006 The questio
- Page 43 and 44: CEIS Health Report 2006 Table 1 - T
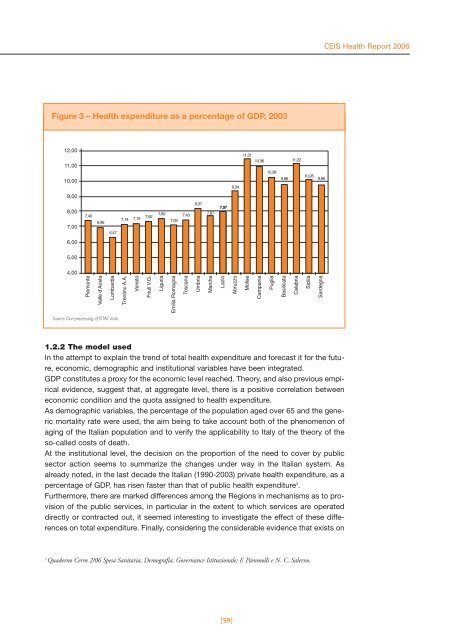
- Page 45 and 46: CEIS Health Report 2006 Figure 3 -
- Page 47 and 48: CEIS Health Report 2006 Figure 6 -
- Page 49 and 50: CEIS Health Report 2006 Figure 8 -
- Page 51 and 52: CEIS Health Report 2006 Figure 10 -
- Page 53 and 54: CEIS Health Report 2006 ciated with
- Page 55 and 56: CEIS Health Report 2006 ● OECD (2
- Page 57: CEIS Health Report 2006 Figure 2 -
- Page 61 and 62: CEIS Health Report 2006 Table 3 - R
- Page 63 and 64: CEIS Health Report 2006 The indicat
- Page 65 and 66: CEIS Health Report 2006 References
- Page 67 and 68: CEIS Health Report 2006 All the var
- Page 69 and 70: CEIS Health Report 2006 Diagram 1 -
- Page 71 and 72: CEIS Health Report 2006 1.4 - Pharm
- Page 73 and 74: CEIS Health Report 2006 % Pharmaceu
- Page 75 and 76: CEIS Health Report 2006 The second
- Page 77 and 78: CEIS Health Report 2006 tion of res
- Page 79 and 80: CEIS Health Report 2006 Table 4 - R
- Page 81 and 82: CEIS Health Report 2006 The variati
- Page 83 and 84: CEIS Health Report 2006 1.5 - The r
- Page 85 and 86: CEIS Health Report 2006 Figure 2 -
- Page 87 and 88: CEIS Health Report 2006 southern Re
- Page 89 and 90: CEIS Health Report 2006 1.5.5 Absor
- Page 91 and 92: CEIS Health Report 2006 For day hos
- Page 93 and 94: CEIS Health Report 2006 There is co
- Page 95 and 96: CEIS Health Report 2006 1.6 - The r
- Page 97 and 98: CEIS Health Report 2006 the Primary
- Page 99 and 100: CEIS Health Report 2006 Table 1 - T
- Page 101 and 102: CEIS Health Report 2006 • “phys
- Page 103 and 104: CEIS Health Report 2006 1.7 - Evolu
- Page 105 and 106: CEIS Health Report 2006 As can be o
- Page 107 and 108: CEIS Health Report 2006 Another int
- Page 109 and 110:
CEIS Health Report 2006 Some signif
- Page 111 and 112:
CEIS Health Report 2006 1.7.5 Concl
- Page 113 and 114:
CEIS Health Report 2006 [114]
- Page 116:
Introduction Public deficit in the
- Page 119 and 120:
CEIS Health Report 2006 The cumulat
- Page 121 and 122:
CEIS Health Report 2006 tegies of i
- Page 123 and 124:
CEIS Health Report 2006 gest that t
- Page 125 and 126:
CEIS Health Report 2006 increase of
- Page 127 and 128:
CEIS Health Report 2006 increase in
- Page 129 and 130:
CEIS Health Report 2006 [130]
- Page 131 and 132:
CEIS Health Report 2006 It is also
- Page 133 and 134:
CEIS Health Report 2006 shifting be
- Page 135 and 136:
CEIS Health Report 2006 year (AIHW
- Page 137 and 138:
CEIS Health Report 2006 cost of the
- Page 139 and 140:
CEIS Health Report 2006 The Second
- Page 141 and 142:
CEIS Health Report 2006 2.5 - Imple
- Page 143 and 144:
CEIS Health Report 2006 2.5.3 Shift
- Page 145 and 146:
CEIS Health Report 2006 Table 1 - P
- Page 147 and 148:
CEIS Health Report 2006 and, conseq
- Page 149 and 150:
CEIS Health Report 2006 Grant whose
- Page 151 and 152:
CEIS Health Report 2006 Generally s
- Page 153 and 154:
CEIS Health Report 2006 Scheme for
- Page 156 and 157:
3.1 - The efficiency of Regional He
- Page 158 and 159:
Table 2 - LEA Financing REGIONS HOS
- Page 160 and 161:
• Campania, with strong financial
- Page 162 and 163:
[163] CEIS Health Report 2006
- Page 164 and 165:
hospital stays has reduced the aver
- Page 166 and 167:
treated varies greatly. The highest
- Page 168 and 169:
CMS = f(COST, CMP, PL, RC, DM , PME
- Page 170 and 171:
formance, implying an increase in a
- Page 172 and 173:
3.3 - The National Health System Ev
- Page 174 and 175:
3.3.3 Cooperation with the Regional
- Page 176 and 177:
the contract conditions are previou
- Page 178 and 179:
Consequentially, in order to avoid
- Page 180 and 181:
order through the MEPA) numbered 14
- Page 182 and 183:
3.4 - Strengthening the capacity fo
- Page 184 and 185:
for designing and governing organiz
- Page 186 and 187:
the hierarchical and management rol
- Page 188 and 189:
tions may appear and disappear, the
- Page 190 and 191:
lop, rather than a variable to be c
- Page 192 and 193:
units along business lines were unq
- Page 194 and 195:
cooperation to achieve the developm
- Page 196 and 197:
However, to manage a multi-site hos
- Page 198 and 199:
Figure 2 - AVS Strategy map • con
- Page 200 and 201:
cialties, but what sets them apart,
- Page 202 and 203:
nistically or quantitatively. Hence
- Page 204 and 205:
portant for healthcare industry, as
- Page 206 and 207:
tor is that General Managers usuall
- Page 208 and 209:
cation of the ABC and, in general,
- Page 210 and 211:
● Kaplan R, Norton D (1992), “T
- Page 212 and 213:
3.7 - The management of healthcare
- Page 214 and 215:
Table 1 - Pathway for st elevated a
- Page 216 and 217:
[217] CEIS Health Report 2006 Table
- Page 218 and 219:
Vaginal childbirth Some synthesis i
- Page 220 and 221:
Politiche sanitarie, marzo-aprile.
- Page 222 and 223:
dental work, the purchase or rental
- Page 224 and 225:
2. We might suppose that the state
- Page 226:
● OECD (2004), “Towards High -
- Page 230 and 231:
4.1 - Equity in the italian healthc
- Page 232 and 233:
Table 2 - Association indexes betwe
- Page 234 and 235:
4.1.5 Structure of health expenditu
- Page 236 and 237:
Table 9 - Regional distribution of
- Page 238 and 239:
strophic payments; moreover, the se
- Page 240:
● Doglia M, Spandonaro F, “Il p
- Page 243 and 244:
CEIS Health Report 2006 (i represen
- Page 245 and 246:
CEIS Health Report 2006 sence of di
- Page 247 and 248:
CEIS Health Report 2006 -0,0030, wh
- Page 249 and 250:
CEIS Health Report 2006 Although co
- Page 252 and 253:
5.1 - The median age at death for m
- Page 254 and 255:
causes and the median age at genera
- Page 256 and 257:
in the South and Islands, not only
- Page 258 and 259:
5.2 - Analysis of avoidable deaths
- Page 260 and 261:
population of Italian citizens acco
- Page 262 and 263:
We wish to underline the mortality
- Page 264 and 265:
Diagram 4 - % composition of years
- Page 266 and 267:
5.2.4 Comments The results of the a
- Page 268 and 269:
among whites and blacks,1979-1989
- Page 270 and 271:
Figure 1 - Division % of the quota
- Page 272 and 273:
Figure 3 - Pharmaceutics expenditur
- Page 274 and 275:
Table 3 - Gross fixed investments i
- Page 276 and 277:
Table 4 - Share of medical device w
- Page 278 and 279:
age dimension of enterprises (90 em
- Page 280 and 281:
BOX 2: National Medical Device Clas
- Page 282 and 283:
maceutiche in Italia (1997-2001)”
- Page 284 and 285:
5.4 - Mobility of italian patients
- Page 286 and 287:
Authority (ASL) will be charged for
- Page 288 and 289:
43.950.716,00. At this stage, if yo
- Page 290 and 291:
esting data are certainly provided
- Page 292 and 293:
have carried out economic and stati
- Page 294 and 295:
[295] CEIS Health Report 2006
- Page 296 and 297:
✔ DE POUVOURVILLE GÉRARD Researc
- Page 298 and 299:
✔ MENNINI FRANCESCO SAVERIO Degre
- Page 300:
✔ SCHWEIGER ARTURO Health Economi