Chapter 2
Chapter 2
Chapter 2

Create successful ePaper yourself
Turn your PDF publications into a flip-book with our unique Google optimized e-Paper software.
CEIS Health Report 2006<br />
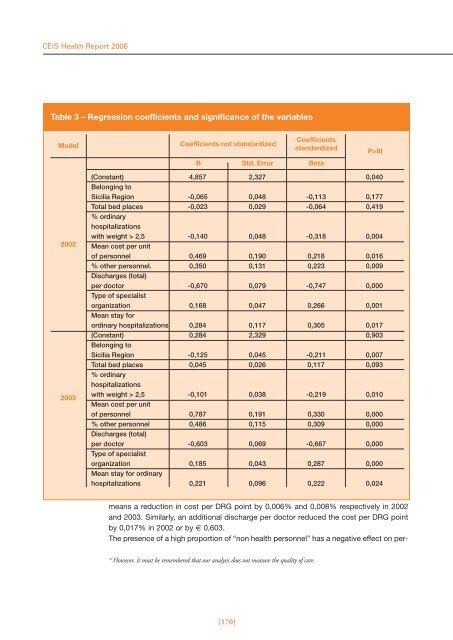
Table 3 – Regression coefficients and significance of the variables<br />
Model<br />
2002<br />
2003<br />
Coefficients not standardized<br />
B Std. Error Beta<br />
(Constant) 4,857 2,327 0,040<br />
Belonging to<br />
Sicilia Region -0,065 0,048 -0,113 0,177<br />
Total bed places -0,023 0,029 -0,064 0,419<br />
% ordinary<br />
hospitalizations<br />
with weight > 2,5 -0,140 0,048 -0,318 0,004<br />
Mean cost per unit<br />
of personnel 0,469 0,190 0,218 0,016<br />
% other personnel. 0,350 0,131 0,223 0,009<br />
Discharges (total)<br />
per doctor -0,670 0,079 -0,747 0,000<br />
Type of specialist<br />
organization 0,168 0,047 0,266 0,001<br />
Mean stay for<br />
ordinary hospitalizations 0,284 0,117 0,305 0,017<br />
(Constant) 0,284 2,329 0,903<br />
Belonging to<br />
Sicilia Region -0,125 0,045 -0,211 0,007<br />
Total bed places 0,045 0,026 0,117 0,093<br />
% ordinary<br />
hospitalizations<br />
with weight > 2,5 -0,101 0,038 -0,219 0,010<br />
Mean cost per unit<br />
of personnel 0,787 0,191 0,330 0,000<br />
% other personnel 0,486 0,115 0,309 0,000<br />
Discharges (total)<br />
per doctor -0,603 0,069 -0,667 0,000<br />
Type of specialist<br />
organization 0,185 0,043 0,287 0,000<br />
Mean stay for ordinary<br />
hospitalizations 0,221 0,096 0,222 0,024<br />
means a reduction in cost per DRG point by 0,006% and 0,008% respectively in 2002<br />
and 2003. Similarly, an additional discharge per doctor reduced the cost per DRG point<br />
by 0,017% in 2002 or by € 0,603.<br />
The presence of a high proportion of “non health personnel” has a negative effect on per-<br />
10 However, it must be remembered that our analysis does not measure the quality of care.<br />
[170]<br />
Coefficients<br />
standardized<br />
P>ltl