Chapter 2
Chapter 2
Chapter 2

Create successful ePaper yourself
Turn your PDF publications into a flip-book with our unique Google optimized e-Paper software.
CMS = f(COST, CMP, PL, RC, DM , PMED, AP, DMS, DREG)<br />
Where<br />
CMS = Mean cost per standardized hospitalization<br />
COST = Constant<br />
CMP = Mean cost of personnel<br />
PL = Bed place<br />
RC = Share of hospitalizations with “weight” > 2,5<br />
DM = Mean length of hospitalization<br />
PMED = Discharges per doctor<br />
AP = Quota of non medical personnel<br />
DMS = Dummy specialist organization<br />
DREG = Dummy Sicilia Region<br />
Apart from the productive work factor CMP (which accounts for by far the greatest share<br />
of the costs, as is well known), attention has been given to PL (bed places) and care complexity<br />
as represented by the proxy RC (share of hospitalizations with a weight greater<br />
than 2,5); productivity was considered in terms of the mean length of hospitalization DM<br />
and discharges per doctor PMED and the mix of non medical personnel in the staff.<br />
The equation estimated with a multiple regression model on the data for 2002 and 2003<br />
produced the following results.<br />
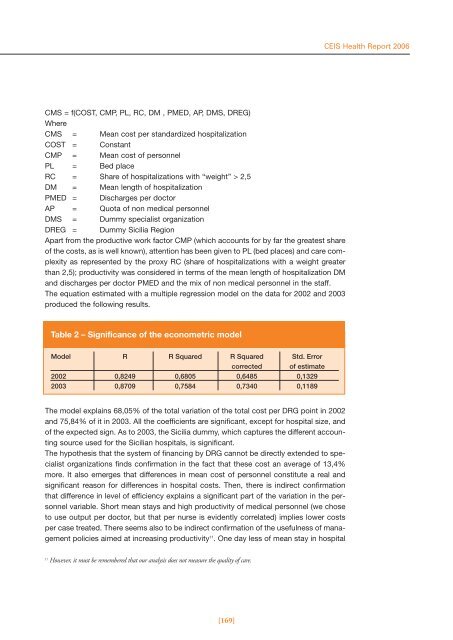
Table 2 – Significance of the econometric model<br />
Model R R Squared R Squared Std. Error<br />
corrected of estimate<br />
2002 0,8249 0,6805 0,6485 0,1329<br />
2003 0,8709 0,7584 0,7340 0,1189<br />
The model explains 68,05% of the total variation of the total cost per DRG point in 2002<br />
and 75,84% of it in 2003. All the coefficients are significant, except for hospital size, and<br />
of the expected sign. As to 2003, the Sicilia dummy, which captures the different accounting<br />
source used for the Sicilian hospitals, is significant.<br />
The hypothesis that the system of financing by DRG cannot be directly extended to specialist<br />
organizations finds confirmation in the fact that these cost an average of 13,4%<br />
more. It also emerges that differences in mean cost of personnel constitute a real and<br />
significant reason for differences in hospital costs. Then, there is indirect confirmation<br />
that difference in level of efficiency explains a significant part of the variation in the personnel<br />
variable. Short mean stays and high productivity of medical personnel (we chose<br />
to use output per doctor, but that per nurse is evidently correlated) implies lower costs<br />
per case treated. There seems also to be indirect confirmation of the usefulness of management<br />
policies aimed at increasing productivity 11 . One day less of mean stay in hospital<br />
11 However, it must be remembered that our analysis does not measure the quality of care.<br />
[169]<br />
CEIS Health Report 2006