Crop Insurance as a Risk Management Strategy in Bangladesh
Crop Insurance as a Risk Management Strategy in Bangladesh
Crop Insurance as a Risk Management Strategy in Bangladesh

You also want an ePaper? Increase the reach of your titles
YUMPU automatically turns print PDFs into web optimized ePapers that Google loves.
Historical<br />
monthly values<br />
Mean Standard deviation<br />
Coefficient<br />
of variation<br />
Future Monthly<br />
Climatic attributes<br />
(12 Months)<br />
1 st<br />
set<br />
n th<br />
set<br />
Future Standard<br />
deviation<br />
GCM Monthly<br />
values<br />
Probability distribution<br />
( Lognormal)<br />
System model for<br />
Flood/Drought/Cyclone<br />
System model for<br />
Flood/Drought/Cyclone<br />
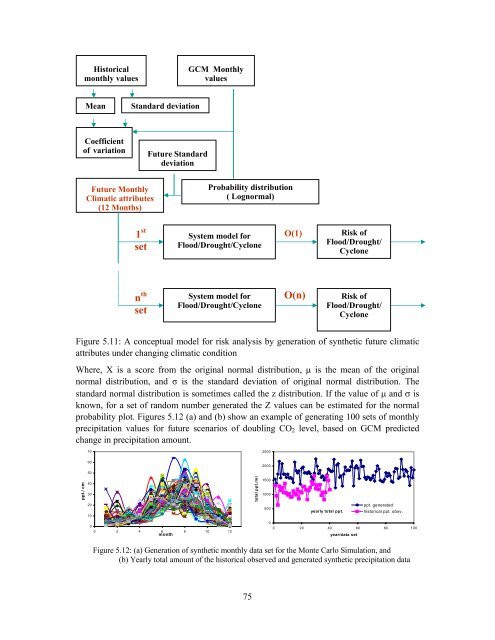
Figure 5.11: A conceptual model for risk analysis by generation of synthetic future climatic<br />
attributes under chang<strong>in</strong>g climatic condition<br />
Where, X is a score from the orig<strong>in</strong>al normal distribution, µ is the mean of the orig<strong>in</strong>al<br />
normal distribution, and σ is the standard deviation of orig<strong>in</strong>al normal distribution. The<br />
standard normal distribution is sometimes called the z distribution. If the value of µ and σ is<br />
known, for a set of random number generated the Z values can be estimated for the normal<br />
probability plot. Figures 5.12 (a) and (b) show an example of generat<strong>in</strong>g 100 sets of monthly<br />
precipitation values for future scenarios of doubl<strong>in</strong>g CO2 level, b<strong>as</strong>ed on GCM predicted<br />
change <strong>in</strong> precipitation amount.<br />
ppt./ cm<br />
70<br />
60<br />
50<br />
40<br />
30<br />
20<br />
10<br />
0<br />
0 2 4 6 8 10 12<br />
month<br />
75<br />
total ppt./mm<br />
2500<br />
2000<br />
1500<br />
1000<br />
500<br />
O(1)<br />
O(n)<br />
<strong>Risk</strong> of<br />
Flood/Drought/<br />
Cyclone<br />
<strong>Risk</strong> of<br />
Flood/Drought/<br />
Cyclone<br />
yearly total ppt.<br />
0<br />
0 20 40 60 80 100<br />
year/data set<br />
ppt. generated<br />
historical ppt. obsv.<br />
Figure 5.12: (a) Generation of synthetic monthly data set for the Monte Carlo Simulation, and<br />
(b) Yearly total amount of the historical observed and generated synthetic precipitation data