vgbe energy journal 7 (2022) - International Journal for Generation and Storage of Electricity and Heat

Create successful ePaper yourself
Turn your PDF publications into a flip-book with our unique Google optimized e-Paper software.
mg<br />
[ ]<br />
mg<br />
[ ]<br />
Emission footprint analysis <strong>of</strong> dispatchable gas-based power generation technologies<br />
1 Legislation overview<br />
1.1 Utilization <strong>of</strong> g/kWh el as an<br />
apples-to-apples metric <strong>for</strong><br />
environmental footprint<br />
analyses<br />
Regulations <strong>and</strong> scientific publications commonly<br />
employ ppmvd 1 , mg/m N 3 , <strong>and</strong> also<br />
non-SI units as metrics <strong>for</strong> quantifying emissions<br />
from dispatchable gas-based power<br />
generation technologies. Emission values<br />
are typically normalized to a reference oxygen<br />
content to account <strong>for</strong> dilution <strong>of</strong> pollutants<br />
due to excess air <strong>and</strong> varying oxygen<br />
contents in the exhaust gas. In most cases,<br />
emissions from GT <strong>and</strong> RICE are normalized<br />
to different oxygen contents 2 . As a result,<br />
normalized emission values cannot be compared<br />
directly. Furthermore, even when the<br />
same reference oxygen content is utilized,<br />
emissions reported in ppmvd or mg/m N ³ do<br />
not account <strong>for</strong> power generation efficiency<br />
associated with the emission release. The<br />
present study uses g/kWh el as an apples-toapples<br />
metric <strong>for</strong> GT <strong>and</strong> RICE emissions to<br />
overcome these limitations. On the one<br />
h<strong>and</strong>, this metric accounts <strong>for</strong> the massbased<br />
emission release, which is essential <strong>for</strong><br />
environmental impact considerations. On<br />
the other h<strong>and</strong>, it considers the electrical efficiency<br />
<strong>of</strong> the investigated power generation<br />
technology, which is a primary indicator <strong>for</strong><br />
a comprehensive technology comparison.<br />
1.2 Comparison <strong>of</strong> major regulatory<br />
frameworks <strong>of</strong> GT <strong>and</strong> RICE<br />
As they impose binding constraints on power<br />
plant operators, regulations have an important<br />
impact on the emission footprint <strong>of</strong><br />
gas-based power generation technologies.<br />
However, significant variations in scope <strong>and</strong><br />
strictness can be observed when considering<br />
1<br />
ppmvd: parts per million by volume (dry)<br />
2<br />
For example, the German 13 th BImSchV defines<br />
a reference oxygen content <strong>of</strong> 15 vol.% <strong>for</strong><br />
GT <strong>and</strong> a reference oxygen content <strong>of</strong> 5 vol.%<br />
<strong>for</strong> RICE [3].<br />
3<br />
Environmental, Health <strong>and</strong> Safety Guidelines<br />
– Small Combustion Facilities Emission Guidelines<br />
[5]<br />
4<br />
Best available techniques (BAT) conclusions<br />
<strong>for</strong> large combustion plants [4]<br />
5<br />
Directive on the limitation <strong>of</strong> emissions from<br />
certain pollutants into the air from medium<br />
combustion plants (EMCP) [6]<br />
6<br />
Verordnung über Großfeuerungs-, Gasturbinen-<br />
und Verbrennungsmotoranlagen (13.<br />
BImSchV) [3]<br />
7<br />
Verordnung über mittelgroße Feuerungs- Gasturbinen-<br />
und Verbrennungsmotoranlagen<br />
(44. BImSchV) [7]<br />
8<br />
Exemplary Environmental Protection Agency<br />
(EPA) site permit [8]<br />
9<br />
The EU BAT conclusions specify value ranges<br />
instead <strong>of</strong> fixed emission limits. There<strong>for</strong>e,<br />
F i g u r e 1 considers the upper <strong>and</strong> lower<br />
bound <strong>of</strong> the respective NO X value ranges<br />
(BAT low <strong>and</strong> high).<br />
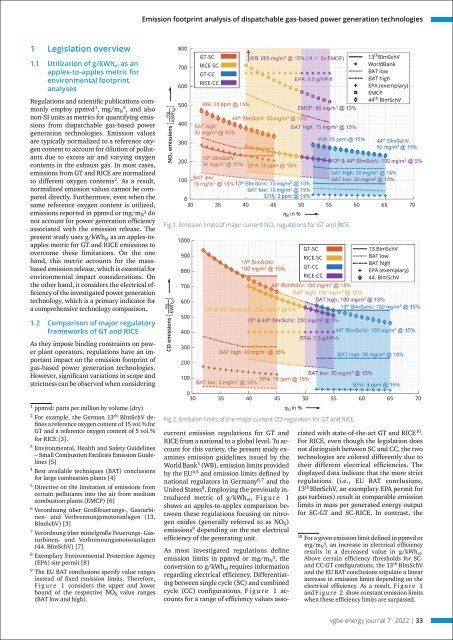
kWh el<br />
NO X emissions<br />
800<br />
700<br />
600<br />
500<br />
400<br />
300<br />
200<br />
100<br />
GT-SC<br />
RICE-SC<br />
GT-CC<br />
RICE-CC<br />
0<br />
30 35 40 45 50 55 60 65 70<br />
el in %<br />
Fig.1. Emission limits <strong>of</strong> major current NO X regulations <strong>for</strong> GT <strong>and</strong> RICE.<br />
kWh el<br />
CO emissions<br />
1000<br />
900<br />
800<br />
700<br />
600<br />
500<br />
400<br />
300<br />
200<br />
100<br />
GT-SC<br />
RICE-SC<br />
GT-CC<br />
RICE-CC<br />
13 th BImSchV<br />
WorldBank<br />
BAT low<br />
BAT high<br />
EPA (exemplary)<br />
EMCP<br />
44 th BImSchV<br />
13.BImSchV<br />
BAT low<br />
BAT high<br />
EPA (exemplary)<br />
44. BImSchV<br />
0<br />
30 35 40 45 50 55 60 65 70<br />
el in %<br />
Fig.2. Emission limits <strong>of</strong> the major current CO regulation <strong>for</strong> GT <strong>and</strong> RICE.<br />
current emission regulations <strong>for</strong> GT <strong>and</strong><br />
RICE from a national to a global level. To account<br />
<strong>for</strong> this variety, the present study examines<br />
emission guidelines issued by the<br />
World Bank 3 (WB), emission limits provided<br />
by the EU 4,5 <strong>and</strong> emission limits defined by<br />
national regulators in Germany 6,7 <strong>and</strong> the<br />
United States 8 . Employing the previously introduced<br />
metric <strong>of</strong> g/kWh el , Figure 1<br />
shows an apples-to-apples comparison between<br />
these regulations focusing on nitrogen<br />
oxides (generally referred to as NO X )<br />
emissions 9 depending on the net electrical<br />
efficiency <strong>of</strong> the generating unit.<br />
As most investigated regulations define<br />
emission limits in ppmvd or mg/m N ³, the<br />
conversion to g/kWh el requires in<strong>for</strong>mation<br />
regarding electrical efficiency. Differentiating<br />
between single cycle (SC) <strong>and</strong> combined<br />
cycle (CC) configurations, F i g u r e 1 accounts<br />
<strong>for</strong> a range <strong>of</strong> efficiency values associated<br />
with state-<strong>of</strong>-the-art GT <strong>and</strong> RICE 10 .<br />
For RICE, even though the legislation does<br />
not distinguish between SC <strong>and</strong> CC, the two<br />
technologies are colored differently due to<br />
their different electrical efficiencies. The<br />
displayed data indicate that the more strict<br />
regulations (i.e., EU BAT conclusions,<br />
13 th BImSchV, an exemplary EPA permit <strong>for</strong><br />
gas turbines) result in comparable emission<br />
limits in mass per generated <strong>energy</strong> output<br />
<strong>for</strong> SC-GT <strong>and</strong> SC-RICE. In contrast, the<br />
10<br />
For a given emission limit defined in ppmvd or<br />
mg/m N ³, an increase in electrical efficiency<br />
results in a decreased value in g/kWh el .<br />
Above certain efficiency thresholds <strong>for</strong> SC<strong>and</strong><br />
CC-GT configurations, the 13 th BImSchV<br />
<strong>and</strong> the EU BAT conclusions stipulate a linear<br />
increase in emission limits depending on the<br />
electrical efficiency. As a result, F i g u r e 1<br />
<strong>and</strong> F i g u r e 2 show constant emission limits<br />
when these efficiency limits are surpassed.<br />
<strong>vgbe</strong> <strong>energy</strong> <strong>journal</strong> 7 · <strong>2022</strong> | 33