vgbe energy journal 7 (2022) - International Journal for Generation and Storage of Electricity and Heat

Create successful ePaper yourself
Turn your PDF publications into a flip-book with our unique Google optimized e-Paper software.
Emission footprint analysis <strong>of</strong> dispatchable gas-based power generation technologies<br />
Tab. 3. Scenario overview <strong>and</strong> full-load emission values <strong>for</strong> plant configuration.<br />
Category Parameter Peaking Scenario Baseload-Scenario<br />
Plant<br />
Configuration<br />
Full-load<br />
Emissions<br />
Load Pr<strong>of</strong>ile<br />
GT RICE GT RICE<br />
Nr. <strong>of</strong> aggregates (& type) 1 x SC 6 2x1 CC 12 8<br />
P el,engine [MW] 57 9,5 163 20,4<br />
η el [%] 39,1 47,4 58,5 48,5<br />
CO 2 [g/kWh el ] 505 417 338 407<br />
CH 4 [mg/kWh el ] 33 2400 22 2400<br />
NO X [mg/kWh el ] 236 (24*) 1400<br />
(140*)<br />
CO [mg/kWh el ] 19 1200<br />
(120*)<br />
158 (16*) 1400<br />
(140*)<br />
13 1200<br />
(120*)<br />
HCHO [mg/kWh el ] 23 90 (9*) 15 90 (9*)<br />
PM [mg/kWh el ] 8 13 5 13<br />
Equivalent full-load hours [h] 3735 6003<br />
Number <strong>of</strong> plant starts per year 286 26<br />
Av. plant load in operation [%] 81 91<br />
Actual operating hours per start 16 254<br />
Year & Calendar week 2020, 40 & 41 2020, 3 & 4<br />
*: with emissions after treatment (EAT) with an assumed constant 90% conversion efficiency<br />
However, the efficiency mode is more appropriate<br />
<strong>for</strong> a direct comparison to a gas turbine<br />
power plant with, in this comparison,<br />
lower transient capabilities.<br />
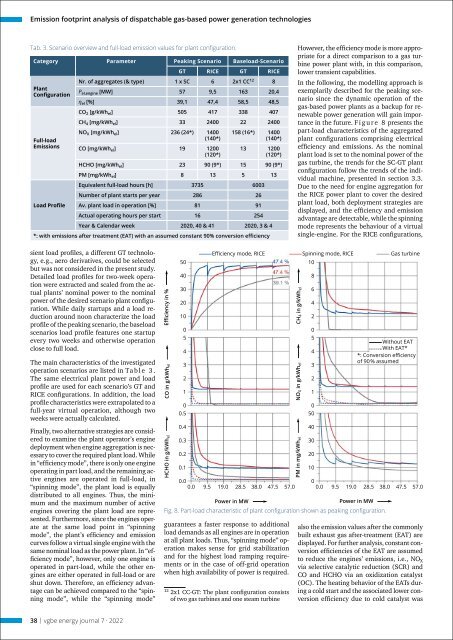
In the following, the modelling approach is<br />
exemplarily described <strong>for</strong> the peaking scenario<br />
since the dynamic operation <strong>of</strong> the<br />
gas-based power plants as a backup <strong>for</strong> renewable<br />
power generation will gain importance<br />
in the future. F i g u r e 8 presents the<br />
part-load characteristics <strong>of</strong> the aggregated<br />
plant configurations comprising electrical<br />
efficiency <strong>and</strong> emissions. As the nominal<br />
plant load is set to the nominal power <strong>of</strong> the<br />
gas turbine, the trends <strong>for</strong> the SC-GT plant<br />
configuration follow the trends <strong>of</strong> the individual<br />
machine, presented in section 3.3.<br />
Due to the need <strong>for</strong> engine aggregation <strong>for</strong><br />
the RICE power plant to cover the desired<br />
plant load, both deployment strategies are<br />
displayed, <strong>and</strong> the efficiency <strong>and</strong> emission<br />
advantage are detectable, while the spinning<br />
mode represents the behaviour <strong>of</strong> a virtual<br />
single-engine. For the RICE configurations,<br />
sient load pr<strong>of</strong>iles, a different GT technology,<br />
e.g., aero derivatives, could be selected<br />
but was not considered in the present study.<br />
Detailed load pr<strong>of</strong>iles <strong>for</strong> two-week operation<br />
were extracted <strong>and</strong> scaled from the actual<br />
plants’ nominal power to the nominal<br />
power <strong>of</strong> the desired scenario plant configuration.<br />
While daily startups <strong>and</strong> a load reduction<br />
around noon characterize the load<br />
pr<strong>of</strong>ile <strong>of</strong> the peaking scenario, the baseload<br />
scenarios load pr<strong>of</strong>ile features one startup<br />
every two weeks <strong>and</strong> otherwise operation<br />
close to full load.<br />
The main characteristics <strong>of</strong> the investigated<br />
operation scenarios are listed in Ta b l e 3 .<br />
The same electrical plant power <strong>and</strong> load<br />
pr<strong>of</strong>ile are used <strong>for</strong> each scenario’s GT <strong>and</strong><br />
RICE configurations. In addition, the load<br />
pr<strong>of</strong>ile characteristics were extrapolated to a<br />
full-year virtual operation, although two<br />
weeks were actually calculated.<br />
Finally, two alternative strategies are considered<br />
to examine the plant operator’s engine<br />
deployment when engine aggregation is necessary<br />
to cover the required plant load. While<br />
in “efficiency mode”, there is only one engine<br />
operating in part load, <strong>and</strong> the remaining active<br />
engines are operated in full-load, in<br />
“spinning mode”, the plant load is equally<br />
distributed to all engines. Thus, the minimum<br />
<strong>and</strong> the maximum number <strong>of</strong> active<br />
engines covering the plant load are represented.<br />
Furthermore, since the engines operate<br />
at the same load point in “spinning<br />
mode”, the plant’s efficiency <strong>and</strong> emission<br />
curves follow a virtual single engine with the<br />
same nominal load as the power plant. In “efficiency<br />
mode”, however, only one engine is<br />
operated in part-load, while the other engines<br />
are either operated in full-load or are<br />
shut down. There<strong>for</strong>e, an efficiency advantage<br />
can be achieved compared to the “spinning<br />
mode”, while the “spinning mode”<br />
50<br />
40<br />
30<br />
Efficiency mode, RICE Spinning mode, RICE Gas turbine<br />
10<br />
HCHO in g/kWh el CO in g/kWh el<br />
Efficiency in %<br />
PM in mg/kWh el<br />
20<br />
10<br />
0<br />
5<br />
4<br />
3<br />
2<br />
1<br />
0<br />
0.5<br />
0.4<br />
0.3<br />
0.2<br />
0.1<br />
Power in MW<br />
Power in MW<br />
Fig. 8. Part-load characteristic <strong>of</strong> plant configuration shown as peaking configuration.<br />
guarantees a faster response to additional<br />
load dem<strong>and</strong>s as all engines are in operation<br />
at all plant loads. Thus, “spinning mode” operation<br />
makes sense <strong>for</strong> grid stabilization<br />
<strong>and</strong> <strong>for</strong> the highest load ramping requirements<br />
or in the case <strong>of</strong> <strong>of</strong>f-grid operation<br />
when high availability <strong>of</strong> power is required.<br />
12<br />
2x1 CC-GT: The plant configuration consists<br />
<strong>of</strong> two gas turbines <strong>and</strong> one steam turbine<br />
CH 4 in g/kWh el<br />
NO X in g/kWh el<br />
0.0<br />
0<br />
0.0 9.5 19.0 28.5 38.0 47.5 57.0 0.0 9.5 19.0 28.5 38.0 47.5 57.0<br />
8<br />
6<br />
4<br />
2<br />
0<br />
5<br />
4<br />
3<br />
2<br />
1<br />
0<br />
50<br />
40<br />
30<br />
20<br />
10<br />
Without EAT<br />
With EAT*<br />
*: Conversion efficiency<br />
<strong>of</strong> 90 % assumed<br />
also the emission values after the commonly<br />
built exhaust gas after-treatment (EAT) are<br />
displayed. For further analysis, constant conversion<br />
efficiencies <strong>of</strong> the EAT are assumed<br />
to reduce the engines’ emissions, i.e., NO X<br />
via selective catalytic reduction (SCR) <strong>and</strong><br />
CO <strong>and</strong> HCHO via an oxidization catalyst<br />
(OC). The heating behavior <strong>of</strong> the EATs during<br />
a cold start <strong>and</strong> the associated lower conversion<br />
efficiency due to cold catalyst was<br />
38 | <strong>vgbe</strong> <strong>energy</strong> <strong>journal</strong> 7 · <strong>2022</strong>