vgbe energy journal 7 (2022) - International Journal for Generation and Storage of Electricity and Heat

Create successful ePaper yourself
Turn your PDF publications into a flip-book with our unique Google optimized e-Paper software.
Emission footprint analysis <strong>of</strong> dispatchable gas-based power generation technologies<br />
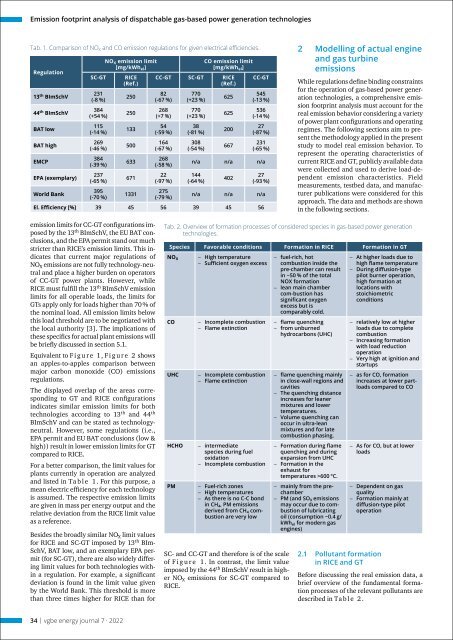
Tab. 1. Comparison <strong>of</strong> NO X <strong>and</strong> CO emission regulations <strong>for</strong> given electrical efficiencies.<br />
Regulation<br />
13 th BImSchV<br />
44 th BImSchV<br />
BAT low<br />
BAT high<br />
EMCP<br />
EPA (exemplary)<br />
World Bank<br />
SC-GT<br />
231<br />
(-8 %)<br />
384<br />
(+54 %)<br />
115<br />
(-14 %)<br />
269<br />
(-46 %)<br />
384<br />
(-39 %)<br />
237<br />
(-65 %)<br />
395<br />
(-70 %)<br />
NO X emission limit<br />
[mg/kWh el ]<br />
RICE<br />
(Ref.)<br />
250<br />
250<br />
133<br />
500<br />
633<br />
671<br />
1331<br />
CO emission limit<br />
[mg/kWh el ]<br />
CC-GT SC-GT RICE<br />
(Ref.)<br />
82<br />
(-67 %)<br />
268<br />
(+7 %)<br />
54<br />
(-59 %)<br />
164<br />
(-67 %)<br />
268<br />
(-58 %)<br />
22<br />
(-97 %)<br />
275<br />
(-79 %)<br />
770<br />
(+23 %)<br />
770<br />
(+23 %)<br />
38<br />
(-81 %)<br />
308<br />
(-54 %)<br />
625<br />
625<br />
200<br />
667<br />
CC-GT<br />
545<br />
(-13 %)<br />
536<br />
(-14 %)<br />
27<br />
(-87 %)<br />
231<br />
(-65 %)<br />
n/a n/a n/a<br />
144<br />
(-64 %)<br />
402<br />
27<br />
(-93 %)<br />
n/a n/a n/a<br />
El. Efficiency [%] 39 45 56 39 45 56<br />
2 Modelling <strong>of</strong> actual engine<br />
<strong>and</strong> gas turbine<br />
emissions<br />
While regulations define binding constraints<br />
<strong>for</strong> the operation <strong>of</strong> gas-based power generation<br />
technologies, a comprehensive emission<br />
footprint analysis must account <strong>for</strong> the<br />
real emission behavior considering a variety<br />
<strong>of</strong> power plant configurations <strong>and</strong> operating<br />
regimes. The following sections aim to present<br />
the methodology applied in the present<br />
study to model real emission behavior. To<br />
represent the operating characteristics <strong>of</strong><br />
current RICE <strong>and</strong> GT, publicly available data<br />
were collected <strong>and</strong> used to derive load-dependent<br />
emission characteristics. Field<br />
measurements, testbed data, <strong>and</strong> manufacturer<br />
publications were considered <strong>for</strong> this<br />
approach. The data <strong>and</strong> methods are shown<br />
in the following sections.<br />
emission limits <strong>for</strong> CC-GT configurations imposed<br />
by the 13 th BImSchV, the EU BAT conclusions,<br />
<strong>and</strong> the EPA permit st<strong>and</strong> out much<br />
stricter than RICE’s emission limits. This indicates<br />
that current major regulations <strong>of</strong><br />
NO X emissions are not fully technology-neutral<br />
<strong>and</strong> place a higher burden on operators<br />
<strong>of</strong> CC-GT power plants. However, while<br />
RICE must fulfill the 13 th BImSchV emission<br />
limits <strong>for</strong> all operable loads, the limits <strong>for</strong><br />
GTs apply only <strong>for</strong> loads higher than 70 % <strong>of</strong><br />
the nominal load. All emission limits below<br />
this load threshold are to be negotiated with<br />
the local authority [3]. The implications <strong>of</strong><br />
these specifics <strong>for</strong> actual plant emissions will<br />
be briefly discussed in section 5.1.<br />
Equivalent to F i g u r e 1 , F i g u r e 2 shows<br />
an apples-to-apples comparison between<br />
major carbon monoxide (CO) emissions<br />
regulations.<br />
The displayed overlap <strong>of</strong> the areas corresponding<br />
to GT <strong>and</strong> RICE configurations<br />
indicates similar emission limits <strong>for</strong> both<br />
technologies according to 13 th <strong>and</strong> 44 th<br />
BImSchV <strong>and</strong> can be stated as technologyneutral.<br />
However, some regulations (i.e.,<br />
EPA permit <strong>and</strong> EU BAT conclusions (low &<br />
high)) result in lower emission limits <strong>for</strong> GT<br />
compared to RICE.<br />
For a better comparison, the limit values <strong>for</strong><br />
plants currently in operation are analyzed<br />
<strong>and</strong> listed in Ta b l e 1 . For this purpose, a<br />
mean electric efficiency <strong>for</strong> each technology<br />
is assumed. The respective emission limits<br />
are given in mass per <strong>energy</strong> output <strong>and</strong> the<br />
relative deviation from the RICE limit value<br />
as a reference.<br />
Besides the broadly similar NO X limit values<br />
<strong>for</strong> RICE <strong>and</strong> SC-GT imposed by 13 th BIm-<br />
SchV, BAT low, <strong>and</strong> an exemplary EPA permit<br />
(<strong>for</strong> SC-GT), there are also widely differing<br />
limit values <strong>for</strong> both technologies within<br />
a regulation. For example, a significant<br />
deviation is found in the limit value given<br />
by the World Bank. This threshold is more<br />
than three times higher <strong>for</strong> RICE than <strong>for</strong><br />
Tab. 2. Overview <strong>of</strong> <strong>for</strong>mation processes <strong>of</strong> considered species in gas-based power generation<br />
technologies.<br />
Species Favorable conditions Formation in RICE Formation in GT<br />
NO X ––<br />
High temperature<br />
––<br />
Sufficient oxygen excess<br />
CO ––<br />
Incomplete combustion<br />
––<br />
Flame extinction<br />
UHC ––<br />
Incomplete combustion<br />
––<br />
Flame extinction<br />
HCHO ––<br />
intermediate<br />
species during fuel<br />
oxidation<br />
––<br />
Incomplete combustion<br />
PM ––<br />
Fuel-rich zones<br />
––<br />
High temperatures<br />
––<br />
As there is no C-C bond<br />
in CH 4 , PM emissions<br />
derived from CH 4 combustion<br />
are very low<br />
SC- <strong>and</strong> CC-GT <strong>and</strong> there<strong>for</strong>e is <strong>of</strong> the scale<br />
<strong>of</strong> F i g u r e 1. In contrast, the limit value<br />
imposed by the 44 th BImSchV result in higher<br />
NO X emissions <strong>for</strong> SC-GT compared to<br />
RICE.<br />
––<br />
fuel-rich, hot<br />
combustion inside the<br />
pre-chamber can result<br />
in ~50 % <strong>of</strong> the total<br />
NOX <strong>for</strong>mation<br />
––<br />
lean main chamber<br />
com-bustion has<br />
significant oxygen<br />
excess but is<br />
comparably cold.<br />
––<br />
flame quenching<br />
––<br />
from unburned<br />
hydrocarbons (UHC)<br />
––<br />
flame quenching mainly<br />
in close-wall regions <strong>and</strong><br />
cavities<br />
––<br />
The quenching distance<br />
increases <strong>for</strong> leaner<br />
mixtures <strong>and</strong> lower<br />
temperatures.<br />
––<br />
Volume quenching can<br />
occur in ultra-lean<br />
mixtures <strong>and</strong> <strong>for</strong> late<br />
combustion phasing.<br />
––<br />
Formation during flame<br />
quenching <strong>and</strong> during<br />
expansion from UHC<br />
––<br />
Formation in the<br />
exhaust <strong>for</strong><br />
temperatures >600 °C.<br />
––<br />
mainly from the prechamber<br />
––<br />
PM (<strong>and</strong> SO X emissions<br />
may occur due to combustion<br />
<strong>of</strong> lubricating<br />
oil (consumption ~0.4 g/<br />
kWh el <strong>for</strong> modern gas<br />
engines)<br />
––<br />
At higher loads due to<br />
high flame temperature<br />
––<br />
During diffusion-type<br />
pilot burner operation,<br />
high <strong>for</strong>mation at<br />
locations with<br />
stoichiometric<br />
conditions<br />
––<br />
relatively low at higher<br />
loads due to complete<br />
combustion<br />
––<br />
Increasing <strong>for</strong>mation<br />
with load reduction<br />
operation<br />
––<br />
Very high at ignition <strong>and</strong><br />
startups<br />
––<br />
as <strong>for</strong> CO, <strong>for</strong>mation<br />
increases at lower partloads<br />
compared to CO<br />
––<br />
As <strong>for</strong> CO, but at lower<br />
loads<br />
––<br />
Dependent on gas<br />
quality<br />
––<br />
Formation mainly at<br />
diffusion-type pilot<br />
operation<br />
2.1 Pollutant <strong>for</strong>mation<br />
in RICE <strong>and</strong> GT<br />
Be<strong>for</strong>e discussing the real emission data, a<br />
brief overview <strong>of</strong> the fundamental <strong>for</strong>mation<br />
processes <strong>of</strong> the relevant pollutants are<br />
described in Ta b l e 2 .<br />
34 | <strong>vgbe</strong> <strong>energy</strong> <strong>journal</strong> 7 · <strong>2022</strong>