STATE OF THE WORLD'S CITIES 2012/2013 Prosperity
STATE OF THE WORLD'S CITIES 2012/2013 Prosperity
STATE OF THE WORLD'S CITIES 2012/2013 Prosperity

Create successful ePaper yourself
Turn your PDF publications into a flip-book with our unique Google optimized e-Paper software.
State of the World’s Cities <strong>2012</strong>/<strong>2013</strong><br />
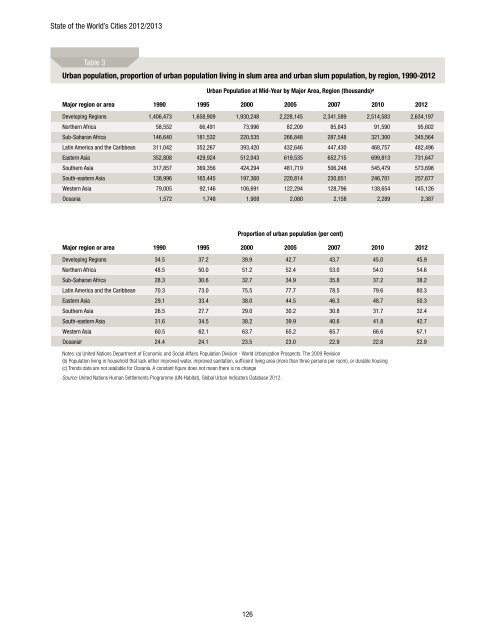
Table 3<br />
Urban population, proportion of urban population living in slum area and urban slum population, by region, 1990-<strong>2012</strong><br />
Urban Population at Mid-year by Major Area, Region (thousands) a<br />
Major region or area 1990 1995 2000 2005 2007 2010 <strong>2012</strong><br />
Developing Regions 1,406,473 1,658,909 1,930,248 2,228,145 2,341,589 2,514,583 2,634,197<br />
Northern Africa 58,552 66,491 73,996 82,209 85,843 91,590 95,602<br />
Sub-Saharan Africa 146,640 181,532 220,535 266,848 287,548 321,300 345,564<br />
Latin America and the Caribbean 311,042 352,267 393,420 432,646 447,430 468,757 482,496<br />
Eastern Asia 352,808 429,924 512,043 619,535 652,715 699,813 731,647<br />
Southern Asia 317,857 369,356 424,294 481,719 506,248 545,479 573,698<br />
South-eastern Asia 138,996 165,445 197,360 220,814 230,851 246,701 257,677<br />
Western Asia 79,005 92,146 106,691 122,294 128,796 138,654 145,126<br />
Oceania 1,572 1,748 1,908 2,080 2,158 2,289 2,387<br />
Proportion of urban population (per cent)<br />
Major region or area 1990 1995 2000 2005 2007 2010 <strong>2012</strong><br />
Developing Regions 34.5 37.2 39.9 42.7 43.7 45.0 45.9<br />
Northern Africa 48.5 50.0 51.2 52.4 53.0 54.0 54.6<br />
Sub-Saharan Africa 28.3 30.6 32.7 34.9 35.8 37.2 38.2<br />
Latin America and the Caribbean 70.3 73.0 75.5 77.7 78.5 79.6 80.3<br />
Eastern Asia 29.1 33.4 38.0 44.5 46.3 48.7 50.3<br />
Southern Asia 26.5 27.7 29.0 30.2 30.8 31.7 32.4<br />
South-eastern Asia 31.6 34.5 38.2 39.9 40.6 41.8 42.7<br />
Western Asia 60.5 62.1 63.7 65.2 65.7 66.6 67.1<br />
Oceania c 24.4 24.1 23.5 23.0 22.9 22.8 22.9<br />
Notes: (a) United Nations Department of Economic and Social Affairs Population Division - World Urbanization Prospects: The 2009 Revision<br />
(b) Population living in household that lack either improved water, improved sanitation, sufficient living area (more than three persons per room), or durable housing<br />
(c) Trends data are not available for Oceania. A constant figure does not mean there is no change<br />
Source: United Nations Human Settlements Programme (UN-Habitat), Global Urban Indicators Database <strong>2012</strong>.<br />
126

![1 statement by dr.[mrs] kakoli ghosh dastidar - Member States Portal](https://img.yumpu.com/27526598/1/190x245/1-statement-by-drmrs-kakoli-ghosh-dastidar-member-states-portal.jpg?quality=85)