STATE OF THE WORLD'S CITIES 2012/2013 Prosperity
STATE OF THE WORLD'S CITIES 2012/2013 Prosperity
STATE OF THE WORLD'S CITIES 2012/2013 Prosperity

You also want an ePaper? Increase the reach of your titles
YUMPU automatically turns print PDFs into web optimized ePapers that Google loves.
1.0<br />
0.9<br />
0.8<br />
0.7<br />
0.6<br />
0.5<br />
0.4<br />
0.3<br />
0.2<br />
0.1<br />
0<br />
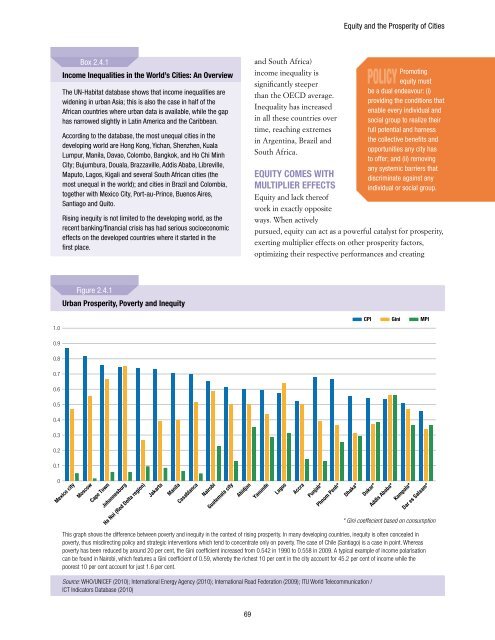
Box 2.4.1<br />
Income Inequalities in the World’s Cities: An Overview<br />
The UN-Habitat database shows that income inequalities are<br />
widening in urban Asia; this is also the case in half of the<br />
African countries where urban data is available, while the gap<br />
has narrowed slightly in Latin America and the Caribbean.<br />
According to the database, the most unequal cities in the<br />
developing world are Hong Kong, Yichan, Shenzhen, Kuala<br />
Lumpur, Manila, Davao, Colombo, Bangkok, and Ho Chi Minh<br />
City; Bujumbura, Douala, Brazzaville, Addis Ababa, Libreville,<br />
Maputo, Lagos, Kigali and several South African cities (the<br />
most unequal in the world); and cities in Brazil and Colombia,<br />
together with Mexico City, Port-au-Prince, Buenos Aires,<br />
Santiago and Quito.<br />
Rising inequity is not limited to the developing world, as the<br />
recent banking/financial crisis has had serious socioeconomic<br />
effects on the developed countries where it started in the<br />
first place.<br />
Figure 2.4.1<br />
Urban <strong>Prosperity</strong>, Poverty and Inequity<br />
69<br />
and South Africa)<br />
income inequality is<br />
significantly steeper<br />
than the OECD average.<br />
Inequality has increased<br />
in all these countries over<br />
time, reaching extremes<br />
in Argentina, Brazil and<br />
South Africa.<br />
EQUITy COMES WITH<br />
MULTIPLIER EFFECTS<br />
Equity and lack thereof<br />
work in exactly opposite<br />
ways. When actively<br />
Equity and the <strong>Prosperity</strong> of Cities<br />
pursued, equity can act as a powerful catalyst for prosperity,<br />
exerting multiplier effects on other prosperity factors,<br />
optimizing their respective performances and creating<br />
CPI Gini MPI<br />
Mexico city<br />
Moscow<br />
Cape Town<br />
Johannesburg<br />
Ha Noi (Red Delta region)<br />
Jakarta<br />
Manila<br />
Casablanca<br />
Nairobi<br />
Guatemala city<br />
Abidjan<br />
Yaounde<br />
Lagos<br />
Accra<br />
Punjab*<br />
Phnom Penh*<br />
Dhaka*<br />
Dakar*<br />
Addis Ababa*<br />
Kampala*<br />
Dar es Salaam*<br />
* Gini coeffecient based on consumption<br />
This graph shows the difference between poverty and inequity in the context of rising prosperity. In many developing countries, inequity is often concealed in<br />
poverty, thus misdirecting policy and strategic interventions which tend to concentrate only on poverty. The case of Chile (Santiago) is a case in point. Whereas<br />
poverty has been reduced by around 20 per cent, the Gini coefficient increased from 0.542 in 1990 to 0.558 in 2009. A typical example of income polarisation<br />
can be found in Nairobi, which features a Gini coefficient of 0.59, whereby the richest 10 per cent in the city account for 45.2 per cent of income while the<br />
poorest 10 per cent account for just 1.6 per cent.<br />
Source: WHO/UNICEF (2010); International Energy Agency (2010); International Road Federation (2009); ITU World Telecommunication /<br />
ICT Indicators Database (2010)<br />
POLICy Promoting<br />
equity must<br />
be a dual endeavour: (i)<br />
providing the conditions that<br />
enable every individual and<br />
social group to realize their<br />
full potential and harness<br />
the collective benefits and<br />
opportunities any city has<br />
to offer; and (ii) removing<br />
any systemic barriers that<br />
discriminate against any<br />
individual or social group.


![1 statement by dr.[mrs] kakoli ghosh dastidar - Member States Portal](https://img.yumpu.com/27526598/1/190x245/1-statement-by-drmrs-kakoli-ghosh-dastidar-member-states-portal.jpg?quality=85)