STATE OF THE WORLD'S CITIES 2012/2013 Prosperity
STATE OF THE WORLD'S CITIES 2012/2013 Prosperity
STATE OF THE WORLD'S CITIES 2012/2013 Prosperity

Create successful ePaper yourself
Turn your PDF publications into a flip-book with our unique Google optimized e-Paper software.
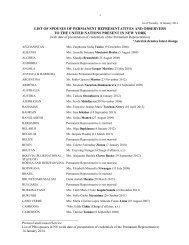
State of the World’s Cities <strong>2012</strong>/<strong>2013</strong><br />
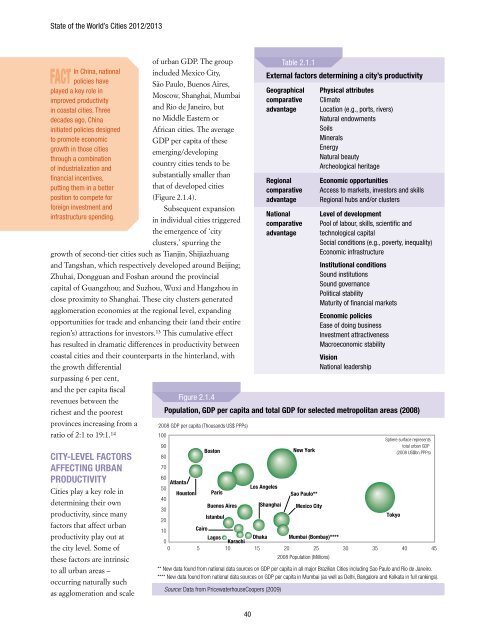
of urban GDP. The group<br />
included Mexico City,<br />
São Paulo, Buenos Aires,<br />
Moscow, Shanghai, Mumbai<br />
and Rio de Janeiro, but<br />
no Middle Eastern or<br />
African cities. The average<br />
GDP per capita of these<br />
emerging/developing<br />
country cities tends to be<br />
substantially smaller than<br />
that of developed cities<br />
(Figure 2.1.4).<br />
Subsequent expansion<br />
in individual cities triggered<br />
the emergence of ‘city<br />
clusters,’ spurring the<br />
growth of second-tier cities such as Tianjin, Shijiazhuang<br />
and Tangshan, which respectively developed around Beijing;<br />
Zhuhai, Dongguan and Foshan around the provincial<br />
capital of Guangzhou; and Suzhou, Wuxi and Hangzhou in<br />
close proximity to Shanghai. These city clusters generated<br />
agglomeration economies at the regional level, expanding<br />
opportunities for trade and enhancing their (and their entire<br />
region’s) attractions for investors. 13 This cumulative effect<br />
has resulted in dramatic differences in productivity between<br />
coastal cities and their counterparts in the hinterland, with<br />
the growth differential<br />
surpassing 6 per cent,<br />
and the per capita fiscal<br />
revenues between the<br />
richest and the poorest<br />
provinces increasing from a<br />
ratio of 2:1 to 19:1. 14<br />
In China, national<br />
FACT policies have<br />
played a key role in<br />
improved productivity<br />
in coastal cities. Three<br />
Table 2.1.1<br />
External factors determining a city’s productivity<br />
Geographical Physical attributes<br />
comparative Climate<br />
advantage Location (e.g., ports, rivers)<br />
decades ago, China<br />
Natural endowments<br />
initiated policies designed<br />
Soils<br />
to promote economic<br />
growth in those cities<br />
through a combination<br />
of industrialization and<br />
financial incentives,<br />
putting them in a better<br />
position to compete for<br />
Regional<br />
comparative<br />
advantage<br />
Minerals<br />
Energy<br />
Natural beauty<br />
Archeological heritage<br />
Economic opportunities<br />
Access to markets, investors and skills<br />
Regional hubs and/or clusters<br />
foreign investment and<br />
infrastructure spending.<br />
National<br />
comparative<br />
Level of development<br />
Pool of labour, skills, scientific and<br />
advantage technological capital<br />
Social conditions (e.g., poverty, inequality)<br />
Economic infrastructure<br />
Institutional conditions<br />
Sound institutions<br />
Sound governance<br />
Political stability<br />
Maturity of financial markets<br />
Economic policies<br />
Ease of doing business<br />
Investment attractiveness<br />
Macroeconomic stability<br />
vision<br />
National leadership<br />
Figure 2.1.4<br />
Population, GDP per capita and total GDP for selected metropolitan areas (2008)<br />
2008 GDP per capita (Thousands US$ PPPs)<br />
100<br />
CITy-LEvEL FACTORS<br />
AFFECTING URBAN<br />
PRODUCTIvITy<br />
Cities play a key role in<br />
determining their own<br />
productivity, since many<br />
factors that affect urban<br />
productivity play out at<br />
the city level. Some of<br />
these factors are intrinsic<br />
to all urban areas –<br />
occurring naturally such<br />
as agglomeration and scale<br />
90<br />
Boston<br />
80<br />
70<br />
60<br />
Atlanta<br />
50<br />
40<br />
Houston Paris<br />
30<br />
Buenos Aires<br />
20<br />
Istanbul<br />
10<br />
Cairo<br />
0<br />
Lagos<br />
Karachi<br />
0 5 10<br />
40<br />
Los Angeles<br />
15<br />
Shanghai<br />
New York<br />
Sao Paulo**<br />
Mexico City<br />
Dhaka Mumbai (Bombay)****<br />
20 25<br />
2008 Population (Millions)<br />
30<br />
35<br />
Sphere surface represents<br />
total urban GDP<br />
(2008 US$bn PPPs)<br />
** New data found from national data sources on GDP per capita in all major Brazilian Cities including Sao Paulo and Rio de Janeiro.<br />
**** New data found from national data sources on GDP per capita in Mumbai (as well as Delhi, Bangalore and Kolkata in full rankings).<br />
Source: Data from PricewaterhouseCoopers (2009)<br />
Tokyo<br />
40<br />
45


![1 statement by dr.[mrs] kakoli ghosh dastidar - Member States Portal](https://img.yumpu.com/27526598/1/190x245/1-statement-by-drmrs-kakoli-ghosh-dastidar-member-states-portal.jpg?quality=85)