Parties, Candidates and Citizens On-Line - Åbo Akademi
Parties, Candidates and Citizens On-Line - Åbo Akademi
Parties, Candidates and Citizens On-Line - Åbo Akademi

Create successful ePaper yourself
Turn your PDF publications into a flip-book with our unique Google optimized e-Paper software.
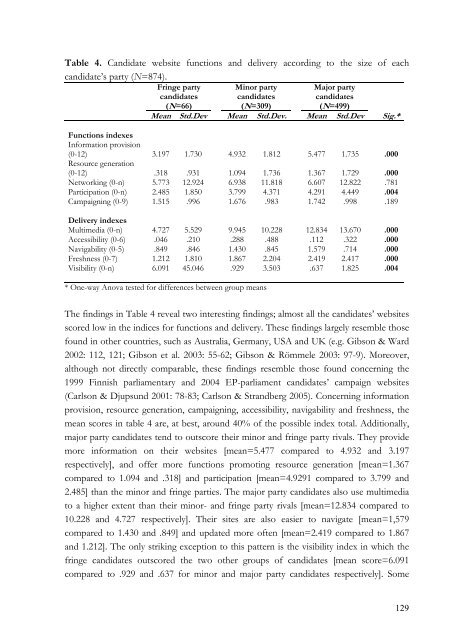
Table 4. C<strong>and</strong>idate website functions <strong>and</strong> delivery according to the size of each<br />
c<strong>and</strong>idate’s party (N=874).<br />
Fringe party<br />
c<strong>and</strong>idates<br />
Minor party Major party<br />
c<strong>and</strong>idates c<strong>and</strong>idates<br />
(N=66)<br />
(N=309)<br />
(N=499)<br />
Mean Std.Dev Mean Std.Dev. Mean Std.Dev Sig.*<br />
Functions indexes<br />
Information provision<br />
(0-12) 3.197 1.730 4.932 1.812 5.477 1.735 .000<br />
Resource generation<br />
(0-12) .318 .931 1.094 1.736 1.367 1.729 .000<br />
Networking (0-n) 5.773 12.924 6.938 11.818 6.607 12.822 .781<br />
Participation (0-n) 2.485 1.850 3.799 4.371 4.291 4.449 .004<br />
Campaigning (0-9) 1.515 .996 1.676 .983 1.742 .998 .189<br />
Delivery indexes<br />
Multimedia (0-n) 4.727 5.529 9.945 10.228 12.834 13.670 .000<br />
Accessibility (0-6) .046 .210 .288 .488 .112 .322 .000<br />
Navigability (0-5) .849 .846 1.430 .845 1.579 .714 .000<br />
Freshness (0-7) 1.212 1.810 1.867 2.204 2.419 2.417 .000<br />
Visibility (0-n) 6.091 45.046 .929 3.503 .637 1.825 .004<br />
* <strong>On</strong>e-way Anova tested for differences between group means<br />
The findings in Table 4 reveal two interesting findings; almost all the c<strong>and</strong>idates’ websites<br />
scored low in the indices for functions <strong>and</strong> delivery. These findings largely resemble those<br />
found in other countries, such as Australia, Germany, USA <strong>and</strong> UK (e.g. Gibson & Ward<br />
2002: 112, 121; Gibson et al. 2003: 55-62; Gibson & Römmele 2003: 97-9). Moreover,<br />
although not directly comparable, these findings resemble those found concerning the<br />
1999 Finnish parliamentary <strong>and</strong> 2004 EP-parliament c<strong>and</strong>idates’ campaign websites<br />
(Carlson & Djupsund 2001: 78-83; Carlson & Str<strong>and</strong>berg 2005). Concerning information<br />
provision, resource generation, campaigning, accessibility, navigability <strong>and</strong> freshness, the<br />
mean scores in table 4 are, at best, around 40% of the possible index total. Additionally,<br />
major party c<strong>and</strong>idates tend to outscore their minor <strong>and</strong> fringe party rivals. They provide<br />
more information on their websites [mean=5.477 compared to 4.932 <strong>and</strong> 3.197<br />
respectively], <strong>and</strong> offer more functions promoting resource generation [mean=1.367<br />
compared to 1.094 <strong>and</strong> .318] <strong>and</strong> participation [mean=4.9291 compared to 3.799 <strong>and</strong><br />
2.485] than the minor <strong>and</strong> fringe parties. The major party c<strong>and</strong>idates also use multimedia<br />
to a higher extent than their minor- <strong>and</strong> fringe party rivals [mean=12.834 compared to<br />
10.228 <strong>and</strong> 4.727 respectively]. Their sites are also easier to navigate [mean=1,579<br />
compared to 1.430 <strong>and</strong> .849] <strong>and</strong> updated more often [mean=2.419 compared to 1.867<br />
<strong>and</strong> 1.212]. The only striking exception to this pattern is the visibility index in which the<br />
fringe c<strong>and</strong>idates outscored the two other groups of c<strong>and</strong>idates [mean score=6.091<br />
compared to .929 <strong>and</strong> .637 for minor <strong>and</strong> major party c<strong>and</strong>idates respectively]. Some<br />
129