McKay, Donald. "Front matter" Multimedia Environmental Models ...
McKay, Donald. "Front matter" Multimedia Environmental Models ...
McKay, Donald. "Front matter" Multimedia Environmental Models ...
You also want an ePaper? Increase the reach of your titles
YUMPU automatically turns print PDFs into web optimized ePapers that Google loves.
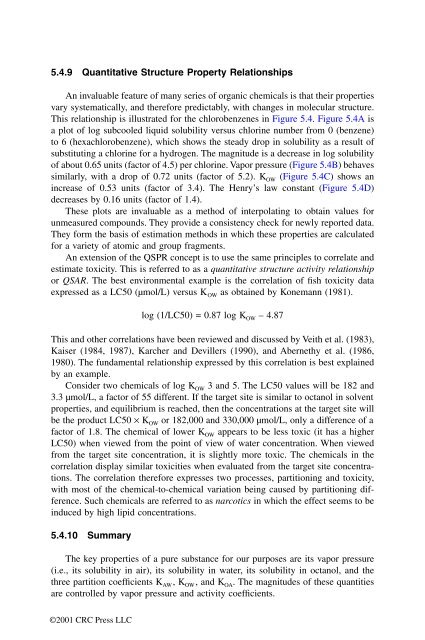
5.4.9 Quantitative Structure Property Relationships<br />
An invaluable feature of many series of organic chemicals is that their properties<br />
vary systematically, and therefore predictably, with changes in molecular structure.<br />
This relationship is illustrated for the chlorobenzenes in Figure 5.4. Figure 5.4A is<br />
a plot of log subcooled liquid solubility versus chlorine number from 0 (benzene)<br />
to 6 (hexachlorobenzene), which shows the steady drop in solubility as a result of<br />
substituting a chlorine for a hydrogen. The magnitude is a decrease in log solubility<br />
of about 0.65 units (factor of 4.5) per chlorine. Vapor pressure (Figure 5.4B) behaves<br />
similarly, with a drop of 0.72 units (factor of 5.2). K OW (Figure 5.4C) shows an<br />
increase of 0.53 units (factor of 3.4). The Henry’s law constant (Figure 5.4D)<br />
decreases by 0.16 units (factor of 1.4).<br />
These plots are invaluable as a method of interpolating to obtain values for<br />
unmeasured compounds. They provide a consistency check for newly reported data.<br />
They form the basis of estimation methods in which these properties are calculated<br />
for a variety of atomic and group fragments.<br />
An extension of the QSPR concept is to use the same principles to correlate and<br />
estimate toxicity. This is referred to as a quantitative structure activity relationship<br />
or QSAR. The best environmental example is the correlation of fish toxicity data<br />
expressed as a LC50 (µmol/L) versus K OW as obtained by Konemann (1981).<br />
©2001 CRC Press LLC<br />
log (1/LC50) = 0.87 log K OW – 4.87<br />
This and other correlations have been reviewed and discussed by Veith et al. (1983),<br />
Kaiser (1984, 1987), Karcher and Devillers (1990), and Abernethy et al. (1986,<br />
1980). The fundamental relationship expressed by this correlation is best explained<br />
by an example.<br />
Consider two chemicals of log K OW 3 and 5. The LC50 values will be 182 and<br />
3.3 µmol/L, a factor of 55 different. If the target site is similar to octanol in solvent<br />
properties, and equilibrium is reached, then the concentrations at the target site will<br />
be the product LC50 ¥ K OW or 182,000 and 330,000 µmol/L, only a difference of a<br />
factor of 1.8. The chemical of lower K OW appears to be less toxic (it has a higher<br />
LC50) when viewed from the point of view of water concentration. When viewed<br />
from the target site concentration, it is slightly more toxic. The chemicals in the<br />
correlation display similar toxicities when evaluated from the target site concentrations.<br />
The correlation therefore expresses two processes, partitioning and toxicity,<br />
with most of the chemical-to-chemical variation being caused by partitioning difference.<br />
Such chemicals are referred to as narcotics in which the effect seems to be<br />
induced by high lipid concentrations.<br />
5.4.10 Summary<br />
The key properties of a pure substance for our purposes are its vapor pressure<br />
(i.e., its solubility in air), its solubility in water, its solubility in octanol, and the<br />
three partition coefficients K AW, K OW, and K OA. The magnitudes of these quantities<br />
are controlled by vapor pressure and activity coefficients.


