

McKay, Donald. "Front matter" Multimedia Environmental Models ...
McKay, Donald. "Front matter" Multimedia Environmental Models ...
McKay, Donald. "Front matter" Multimedia Environmental Models ...

You also want an ePaper? Increase the reach of your titles
YUMPU automatically turns print PDFs into web optimized ePapers that Google loves.
8.14.1 Introduction<br />
©2001 CRC Press LLC<br />
8.14 HUMAN EXPOSURE TO CHEMICALS<br />
The multimedia environmental models described in this chapter lead to estimates<br />
of fugacities and concentrations in air, water, soil, and sediments. These abiotic<br />
fugacities can be used to deduce fugacities and concentrations in fish, and possibly<br />
in other animals and plants. The primary weakness is probably that they do not yet<br />
adequately quantify partitioning into the variety of vegetable matter that is consumed<br />
by animals and humans. For some compounds, such as the dioxins, the air-grasscow-milk-dairy<br />
product-human route of transfer is critical. In this chapter, we discuss<br />
briefly the principles by which these concentration data can be used to assess the<br />
impact of chemicals on humans and other organisms. The reader is directed to<br />
reviews such as that by Paustenbach (2000) for a detailed treatment of exposure and<br />
risk assessment.<br />
The first obvious use of these abiotic and biotic concentrations is to compare<br />
them with concentration levels that are believed to cause adverse effects. These<br />
levels are usually developed by regulatory agencies and published as guidelines,<br />
objectives, or effect-concentrations of various types. Target or objective concentrations<br />
can be defined for most media. For example, from considerations of toxicity<br />
or aesthetics, it may be possible to suggest that water concentrations should be<br />
maintained below 1 mg/m 3 , air below 1 mg/m 3 , and fish below 1 mg/kg. These<br />
concentrations can be compared as a ratio or quotient to the estimated environmental<br />
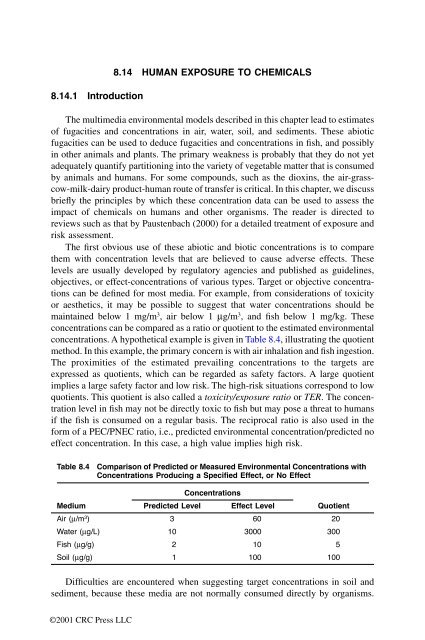
concentrations. A hypothetical example is given in Table 8.4, illustrating the quotient<br />
method. In this example, the primary concern is with air inhalation and fish ingestion.<br />
The proximities of the estimated prevailing concentrations to the targets are<br />
expressed as quotients, which can be regarded as safety factors. A large quotient<br />
implies a large safety factor and low risk. The high-risk situations correspond to low<br />
quotients. This quotient is also called a toxicity/exposure ratio or TER. The concentration<br />
level in fish may not be directly toxic to fish but may pose a threat to humans<br />
if the fish is consumed on a regular basis. The reciprocal ratio is also used in the<br />
form of a PEC/PNEC ratio, i.e., predicted environmental concentration/predicted no<br />
effect concentration. In this case, a high value implies high risk.<br />
Table 8.4 Comparison of Predicted or Measured <strong>Environmental</strong> Concentrations with<br />
Concentrations Producing a Specified Effect, or No Effect<br />
Concentrations<br />
Medium Predicted Level Effect Level Quotient<br />
Air (m/m3 ) 3 60 20<br />
Water (mg/L) 10 3000 300<br />
Fish (mg/g) 2 10 5<br />
Soil (mg/g) 1 100 100<br />
Difficulties are encountered when suggesting target concentrations in soil and<br />
sediment, because these media are not normally consumed directly by organisms.


