

McKay, Donald. "Front matter" Multimedia Environmental Models ...
McKay, Donald. "Front matter" Multimedia Environmental Models ...
McKay, Donald. "Front matter" Multimedia Environmental Models ...

You also want an ePaper? Increase the reach of your titles
YUMPU automatically turns print PDFs into web optimized ePapers that Google loves.
mated again in mg/day. Food, the other vehicle, is more difficult to estimate. A typical<br />
diet may consist of 1 kg/day of solids broken down as shown in Table 8.5. Fish<br />
concentrations can be estimated directly from water concentrations, but meat, vegetable,<br />
and dairy product concentrations are still poorly understood functions of the<br />
concentrations of chemical in air, water, soil, and animal feeds, and of agrochemical<br />
usage. Techniques are emerging for calculating food-environment concentration<br />
ratios, but at present the best approach is to analyze a typical purchased “food<br />
basket.” This issue is complicated by the fact that much food is grown at distant<br />
locations and imported. Beverages, food, and water may also be treated for chemical<br />
removal commercially or domestically by washing, peeling, or cooking. An example<br />
illustrates this method of estimating dose.<br />
Worked Example 8.4<br />
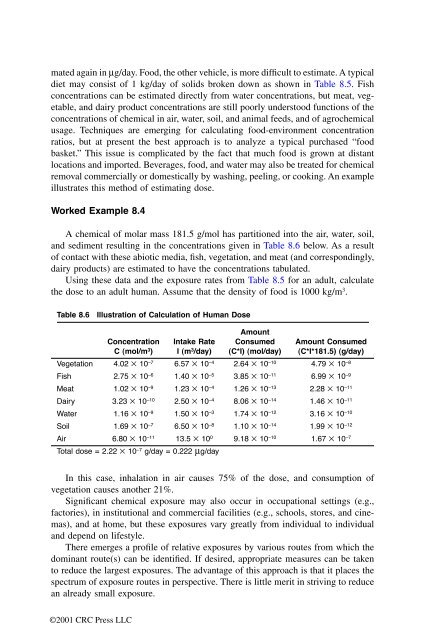
A chemical of molar mass 181.5 g/mol has partitioned into the air, water, soil,<br />
and sediment resulting in the concentrations given in Table 8.6 below. As a result<br />
of contact with these abiotic media, fish, vegetation, and meat (and correspondingly,<br />
dairy products) are estimated to have the concentrations tabulated.<br />
Using these data and the exposure rates from Table 8.5 for an adult, calculate<br />
the dose to an adult human. Assume that the density of food is 1000 kg/m 3 .<br />
Table 8.6 Illustration of Calculation of Human Dose<br />
Concentration<br />
C (mol/m 3 )<br />
In this case, inhalation in air causes 75% of the dose, and consumption of<br />
vegetation causes another 21%.<br />
Significant chemical exposure may also occur in occupational settings (e.g.,<br />
factories), in institutional and commercial facilities (e.g., schools, stores, and cinemas),<br />
and at home, but these exposures vary greatly from individual to individual<br />
and depend on lifestyle.<br />
There emerges a profile of relative exposures by various routes from which the<br />
dominant route(s) can be identified. If desired, appropriate measures can be taken<br />
to reduce the largest exposures. The advantage of this approach is that it places the<br />
spectrum of exposure routes in perspective. There is little merit in striving to reduce<br />
an already small exposure.<br />
©2001 CRC Press LLC<br />
Intake Rate<br />
I (m 3 /day)<br />
Amount<br />
Consumed<br />
(C*I) (mol/day)<br />
Amount Consumed<br />
(C*I*181.5) (g/day)<br />
Vegetation 4.02 ¥ 10 –7 6.57 ¥ 10 –4 2.64 ¥ 10 –10 4.79 ¥ 10 –8<br />
Fish 2.75 ¥ 10 –6 1.40 ¥ 10 –5 3.85 ¥ 10 –11 6.99 ¥ 10 –9<br />
Meat 1.02 ¥ 10 –9 1.23 ¥ 10 –4 1.26 ¥ 10 –13 2.28 ¥ 10 –11<br />
Dairy 3.23 ¥ 10 –10 2.50 ¥ 10 –4 8.06 ¥ 10 –14 1.46 ¥ 10 –11<br />
Water 1.16 ¥ 10 –9 1.50 ¥ 10 –3 1.74 ¥ 10 –12 3.16 ¥ 10 –10<br />
Soil 1.69 ¥ 10 –7 6.50 ¥ 10 –8 1.10 ¥ 10 –14 1.99 ¥ 10 –12<br />
Air 6.80 ¥ 10 –11 13.5 ¥ 100 9.18 ¥ 10 –10 1.67 ¥ 10 –7<br />
Total dose = 2.22 ¥ 10 –7 g/day = 0.222 mg/day


