- Page 1 and 2:
McKay, Donald. "Front matter" Multi
- Page 3 and 4:
Multimedia Environmental Models The
- Page 5 and 6:
hensive, and reliable, and they hav
- Page 7 and 8:
Chapter 1 Introduction Chapter 2 So
- Page 9 and 10:
McKay, Donald. "Introduction" Multi
- Page 11 and 12:
It is now evident that our task is
- Page 13 and 14:
McKay, Donald. "Some Basic Concepts
- Page 15 and 16:
give the derived units directly wit
- Page 17 and 18:
Energy (joule, J) The joule, which
- Page 19 and 20:
particles (aerosols), or biota in w
- Page 21 and 22:
Worked Example 2.1 A three-phase sy
- Page 23 and 24:
(i) What is the concentration (C) i
- Page 25 and 26:
Answer ©2001 CRC Press LLC 5.1 kg,
- Page 27 and 28:
or or When t is zero, C is zero, th
- Page 29 and 30:
What is the absolute minimum piscic
- Page 31 and 32:
©2001 CRC Press LLC C 1 = C O/(1 +
- Page 33 and 34:
containing nonequilibrium quantitie
- Page 35 and 36: 1. Fallout of chemical from air to
- Page 37 and 38: validated using real environments.
- Page 39 and 40: ©2001 CRC Press LLC CHAPTER 3 Envi
- Page 41 and 42: of other, somewhat similar or homol
- Page 43 and 44: Table 3.2 List of Chemicals Commonl
- Page 45 and 46: elatively high concentrations. This
- Page 47 and 48: exists between toxicologists and ch
- Page 49 and 50: determine priority. This is a subje
- Page 51 and 52: Another important classification of
- Page 53 and 54: Figure 3.1 (continued) ©2001 CRC P
- Page 55 and 56: Table 3.5 (continued) dichlorometha
- Page 57 and 58: Table 3.5 (continued) total PCB 326
- Page 59 and 60: Figure 3.2 Plot of log K AW vs. log
- Page 61 and 62: chlorofluoro compounds are very sta
- Page 63 and 64: 3.3.2.7 Arsenic Compounds Arsenic,
- Page 65 and 66: McKay, Donald. "The Nature of Envir
- Page 67 and 68: Figure 4.1 Evaluative environments.
- Page 69 and 70: are subject to two important deposi
- Page 71 and 72: metals and organic chemicals from w
- Page 73 and 74: carbon figure for deeper sediments
- Page 75 and 76: flows. The quality of this groundwa
- Page 77 and 78: Table 4.2 Evaluative Environments A
- Page 79 and 80: McKay, Donald. "Phase Equilibrium"
- Page 81 and 82: Figure 5.1 Some principles and conc
- Page 83 and 84: likely using an equilibrium criteri
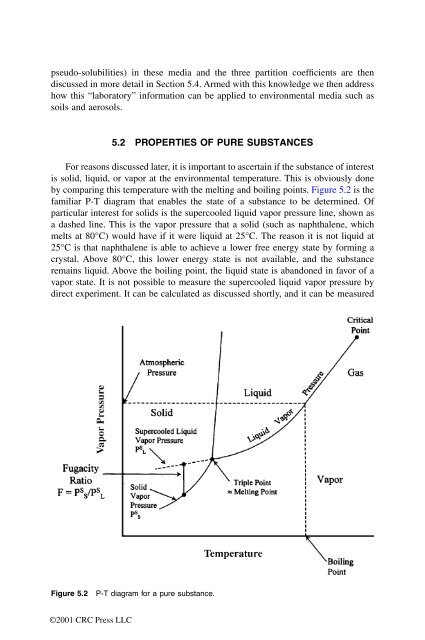
- Page 85: Another useful quantity is the rati
- Page 89 and 90: ©2001 CRC Press LLC 5.3 PROPERTIES
- Page 91 and 92: 1.0. This, then, is the fugacity or
- Page 93 and 94: where ©2001 CRC Press LLC pH is -l
- Page 95 and 96: In terms of solubilities, S iA and
- Page 97 and 98: The temperature coefficient is the
- Page 99 and 100: (1982), Baum (1997) and Leo (2000).
- Page 101 and 102: Although it may appear environmenta
- Page 103 and 104: Figure 5.4 Illustration of quantita
- Page 105 and 106: 5.5 ENVIRONMENTAL PARTITION COEFFIC
- Page 107 and 108: C S = K PC W benzene = 1.1 ¥ 0.001
- Page 109 and 110: Mackay (1986), in an attempt to sim
- Page 111 and 112: Compartment Definition of Fugacity
- Page 113 and 114: high concentration in the fish, but
- Page 115 and 116: heat capacity of 0.38 J/g°C requir
- Page 117 and 118: Therefore, ©2001 CRC Press LLC f =
- Page 119 and 120: ©2001 CRC Press LLC Z T = S(V i/V
- Page 121 and 122: ©2001 CRC Press LLC air Z = P S /R
- Page 123 and 124: Table 5.1 Table 5.1 Summary of Defi
- Page 125 and 126: Figure 5.7 Fugacity form 1 for dedu
- Page 127 and 128: Calculate the following physical-ch
- Page 129 and 130: ©2001 CRC Press LLC CHAPTER 6 Adve
- Page 131 and 132: that all water will spend 100 days
- Page 133 and 134: This enables us to conceive of, and
- Page 135 and 136: ©2001 CRC Press LLC f = 15/0.5 = 3
- Page 137 and 138:
D AS dominates. A residence time of
- Page 139 and 140:
and Therefore, ©2001 CRC Press LLC
- Page 141 and 142:
eaction situation in which there is
- Page 143 and 144:
The rate constants in each case are
- Page 145 and 146:
©2001 CRC Press LLC 1/t O = SD Ai/
- Page 147 and 148:
e achieved in 10 days. Detractors o
- Page 149 and 150:
sulfate to sulfide or by dechlorina
- Page 151 and 152:
to Zepp and Cline (1977) for the or
- Page 153 and 154:
©2001 CRC Press LLC 6.7 LEVEL II C
- Page 155 and 156:
Figure 6.3 Fugacity Level II calcul
- Page 157 and 158:
McKay, Donald. "Intermedia Transpor
- Page 159 and 160:
Figure 7.1 Illustration of nonequil
- Page 161 and 162:
5. Diffusion within soils, and from
- Page 163 and 164:
sionally, the term flux rate is use
- Page 165 and 166:
©2001 CRC Press LLC N = ABDC/ Dy m
- Page 167 and 168:
no currents or eddies. In practice,
- Page 169 and 170:
diffusivity, and some unknown layer
- Page 171 and 172:
where ©2001 CRC Press LLC X = y/ U
- Page 173 and 174:
fraction of the total volume that i
- Page 175 and 176:
Figure 7.6 Mass transfer at the int
- Page 177 and 178:
partition coefficient. The signific
- Page 179 and 180:
and the series retains a similar ra
- Page 181 and 182:
ments of resuspension rates are par
- Page 183 and 184:
Figure 7.8 Movement of air phase (k
- Page 185 and 186:
ates can thus be used to estimate m
- Page 187 and 188:
Figure 7.9 Combination of D values
- Page 189 and 190:
Figure 7.10 Four-compartment Level
- Page 191 and 192:
Table 7.2 Order of Magnitude Values
- Page 193 and 194:
Unlike the Level II calculation, it
- Page 195 and 196:
Figure 7.12 Sample Level III output
- Page 197 and 198:
McKay, Donald. "Applications of Fug
- Page 199 and 200:
applications. Citations are given t
- Page 201 and 202:
Another approach is to employ Monte
- Page 203 and 204:
LEVEL1B A six-compartment Level I p
- Page 205 and 206:
Figure 8.1 Air-water exchange proce
- Page 207 and 208:
The total rates of transfer are thu
- Page 209 and 210:
Figure 8.2 Chemical transport and t
- Page 211 and 212:
mean. For chemical between depths o
- Page 213 and 214:
8.5.2 Process Description The water
- Page 215 and 216:
learn the benefits of using fugacit
- Page 217 and 218:
where Figure 8.5 QWASI model: stead
- Page 219 and 220:
are similar to those described by M
- Page 221 and 222:
C F ª Z Ff W ª 1.608 mol/m 3 ª 4
- Page 223 and 224:
y Mackay et al. (1983), and an appl
- Page 225 and 226:
accordingly, but the final solution
- Page 227 and 228:
Figure 8.10 Fish bioaccumulation pr
- Page 229 and 230:
The nature of the processes control
- Page 231 and 232:
iomagnification is more significant
- Page 233 and 234:
An alternative and more elegant met
- Page 235 and 236:
8.11.2 Model of a Chemical Evaporat
- Page 237 and 238:
Paterson et al. (1991), and Hung an
- Page 239 and 240:
8.14.1 Introduction ©2001 CRC Pres
- Page 241 and 242:
mated again in mg/day. Food, the ot
- Page 243 and 244:
models. Most interest is in LRT in
- Page 245 and 246:
available from the University of To
- Page 247 and 248:
McKay, Donald. "Appendix" Multimedi
- Page 249 and 250:
©2001 CRC Press LLC


