Panorama Educativo de México 2009 - Instituto Nacional para la ...
Panorama Educativo de México 2009 - Instituto Nacional para la ...
Panorama Educativo de México 2009 - Instituto Nacional para la ...

Create successful ePaper yourself
Turn your PDF publications into a flip-book with our unique Google optimized e-Paper software.
<strong>Panorama</strong> <strong>Educativo</strong> <strong>de</strong> México <strong>2009</strong><br />
CS08-1<br />
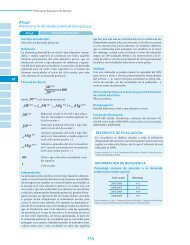
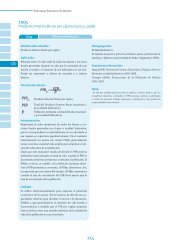
Porcentaje <strong>de</strong> pob<strong>la</strong>ción por grupos <strong>de</strong> edad y sexo, según<br />
nivel educativo alcanzado (2005)<br />
CS<br />
Grupos <strong>de</strong> edad<br />
15 -24 años<br />
25 -34 años<br />
35 -44 años<br />
45 -54 años<br />
55 -64 años<br />
25 -64 años<br />
15 años y más<br />
Sexo<br />
Sin<br />
esco<strong>la</strong>ridad<br />
Sin básica<br />
Nivel educativo alcanzado<br />
Con básica<br />
Media<br />
superior<br />
Superior<br />
Pob<strong>la</strong>ción total¹<br />
Hombres 2.1 27.4 47.0 20.1 3.4 9 130 979<br />
Mujeres 2.2 25.5 46.7 21.4 4.3 9 669 500<br />
Total 2.1 26.4 46.8 20.8 3.9 18 800 479<br />
Hombres 3.3 30.6 34.3 17.2 14.5 7 463 760<br />
Mujeres 3.9 32.4 34.9 14.9 13.9 8 350 090<br />
Total 3.6 31.6 34.6 16.0 14.2 15 813 850<br />
Hombres 4.8 35.6 29.1 15.4 15.0 6 166 550<br />
Mujeres 7.0 39.4 30.4 11.4 11.8 6 763 155<br />
Total 6.0 37.6 29.8 13.3 13.3 12 929 705<br />
Hombres 8.4 46.9 18.6 10.2 15.8 4 295 957<br />
Mujeres 12.9 51.8 19.7 6.7 8.9 4 674 089<br />
Total 10.7 49.5 19.2 8.4 12.2 8 970 046<br />
Hombres 16.6 55.4 11.9 5.7 10.4 2 704 334<br />
Mujeres 23.9 55.6 12.5 3.5 4.4 2 936 771<br />
Total 20.4 55.5 12.2 4.6 7.3 5 641 105<br />
Hombres 6.6 38.8 26.5 13.7 14.4 20 630 601<br />
Mujeres 9.2 41.5 27.6 10.7 11.0 22 724 105<br />
Total 8.0 40.2 27.1 12.1 12.6 43 354 706<br />
Hombres 7.2 36.9 30.7 14.7 10.5 32 363 473<br />
Mujeres 9.7 37.9 31.1 12.9 8.4 35 382 957<br />
Total 8.5 37.4 30.9 13.7 9.4 67 746 430<br />
¹ El dato <strong>de</strong> pob<strong>la</strong>ción total no incluye los casos con esco<strong>la</strong>ridad no especificada. Entre <strong>la</strong> pob<strong>la</strong>ción <strong>de</strong> 25 a 64 años se registró 1.5% <strong>de</strong> esta c<strong>la</strong>se <strong>de</strong> casos.<br />
Fuente: INEE, estimaciones con base en el II Conteo <strong>de</strong> Pob<strong>la</strong>ción y Vivienda 2005, Inegi.<br />
Los cálculos basados en el II Conteo <strong>de</strong> Pob<strong>la</strong>ción y<br />
Vivienda 2005, cuyos resultados se muestran en <strong>la</strong><br />
tab<strong>la</strong> CS08-1, indican que <strong>la</strong> esco<strong>la</strong>ridad está aumentando<br />
constantemente <strong>de</strong> generación en<br />
generación. Los porcentajes <strong>de</strong> <strong>la</strong> pob<strong>la</strong>ción más<br />
esco<strong>la</strong>rizada han venido creciendo a <strong>la</strong> vez que ha<br />
ocurrido lo contrario con los <strong>de</strong> menores estudios.<br />
Esto es notorio si se com<strong>para</strong> <strong>la</strong> situación <strong>de</strong> los grupos<br />
<strong>de</strong> 25 a 34 y <strong>de</strong> 55 a 64 años. Mientras en éste, el<br />
<strong>de</strong> mayor edad, 10.4% y 4.4% <strong>de</strong> los hombres y mujeres,<br />
respectivamente, tenían educación superior,<br />
en el primero <strong>la</strong>s cifras son más elevadas por más <strong>de</strong><br />
4 y 9 puntos porcentuales, respectivamente; por el<br />
contrario, los porcentajes <strong>de</strong> hombres y mujeres sin<br />
esco<strong>la</strong>ridad en el grupo <strong>de</strong> 25 a 34 años eran menores<br />
en 13 y 20 puntos porcentuales en com<strong>para</strong>ción<br />
con sus contrapartes <strong>de</strong> 55 a 64 años.<br />
Contexto Social<br />
103<br />
EMS_<strong>Panorama</strong>09_6-mayo-11_A.indd 103<br />
6/27/11 12:12 PM