Panorama Educativo de México 2009 - Instituto Nacional para la ...
Panorama Educativo de México 2009 - Instituto Nacional para la ...
Panorama Educativo de México 2009 - Instituto Nacional para la ...

Create successful ePaper yourself
Turn your PDF publications into a flip-book with our unique Google optimized e-Paper software.
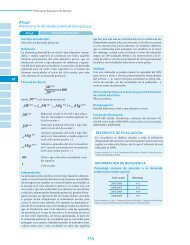
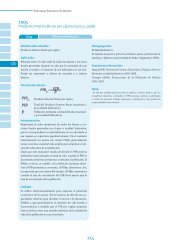
Indicadores <strong>de</strong>l Sistema <strong>Educativo</strong> <strong>Nacional</strong>. Educación Media Superior.<br />
CS06b-2<br />
Porcentaje <strong>de</strong> pob<strong>la</strong>ción joven que asiste a media superior, respecto <strong>de</strong><br />
aquél<strong>la</strong> atendible 1 según tamaño <strong>de</strong> localidad, por entidad fe<strong>de</strong>rativa y<br />
grupos <strong>de</strong> edad (18-29 y 15-29 años) (2005)<br />
Entidad<br />
fe<strong>de</strong>rativa<br />
Grupos <strong>de</strong> edad<br />
18-29 años 15-29 años<br />
Total Rural Semiurbana Urbana Total Rural Semiurbana Urbana<br />
Aguascalientes 10.2 4.9 6.3 12.3 31.9 19.9 25.2 36.1<br />
Baja California 11.1 7.6 9.5 11.5 31.6 25.0 29.4 32.3<br />
Baja California Sur 10.8 7.0 10.8 11.6 36.2 28.8 38.1 37.1<br />
Campeche 16.3 10.8 17.0 18.3 38.8 30.0 43.5 41.1<br />
Coahui<strong>la</strong> 8.3 4.4 5.3 8.9 28.9 19.8 24.8 30.2<br />
Colima 13.7 10.3 10.9 14.9 36.2 27.8 31.6 38.7<br />
Chiapas 17.2 15.0 18.8 18.9 40.2 33.3 45.2 45.8<br />
Chihuahua 11.9 8.3 10.2 12.5 35.3 28.6 36.9 36.0<br />
Distrito Fe<strong>de</strong>ral 21.5 13.5 18.3 21.6 41.7 31.8 36.4 41.8<br />
Durango 10.1 5.9 8.6 12.7 33.2 22.2 37.1 38.5<br />
Guanajuato 10.3 5.9 7.3 12.5 29.3 20.3 26.7 33.5<br />
Guerrero 15.6 13.0 17.3 16.8 40.8 33.0 46.8 44.2<br />
Hidalgo 11.0 8.2 10.4 16.1 32.9 26.9 33.8 41.5<br />
Jalisco 14.1 8.8 11.6 15.2 33.3 25.0 33.0 34.7<br />
México 12.2 6.4 8.5 14.0 32.7 22.4 27.3 35.6<br />
Michoacán 12.6 8.1 10.7 15.9 33.7 23.7 33.8 39.5<br />
Morelos 11.8 8.1 10.2 13.4 34.3 26.9 32.0 37.1<br />
Nayarit 11.3 7.9 9.2 15.3 35.9 27.8 33.9 43.1<br />
Nuevo León 8.0 4.8 4.9 8.3 25.2 17.6 18.2 25.9<br />
Oaxaca 15.3 12.5 16.9 18.8 38.0 31.9 43.1 44.2<br />
Pueb<strong>la</strong> 11.2 8.8 8.5 13.7 35.6 30.4 31.9 40.2<br />
Querétaro 10.3 5.1 6.6 14.9 29.8 18.6 23.4 38.7<br />
Quintana Roo 11.2 9.0 10.5 11.6 29.6 24.9 30.2 30.3<br />
San Luis Potosí 10.0 7.1 9.6 12.3 31.7 23.7 33.7 37.1<br />
Sinaloa 13.3 9.0 11.5 16.0 43.4 35.5 44.6 47.0<br />
Sonora 11.0 8.0 9.2 11.9 35.8 27.7 35.6 37.3<br />
Tabasco 13.2 10.1 13.6 18.1 36.7 30.5 38.2 45.6<br />
Tamaulipas 9.2 6.1 7.9 9.8 32.2 24.2 33.8 33.4<br />
T<strong>la</strong>xca<strong>la</strong> 9.1 6.5 9.0 11.1 31.8 26.8 32.1 34.9<br />
Veracruz 15.8 13.4 14.9 18.0 41.5 37.7 41.5 44.4<br />
Yucatán 15.4 7.8 10.9 19.5 35.7 21.7 30.1 42.0<br />
Zacatecas 10.1 6.2 8.9 15.4 31.2 21.1 35.9 40.9<br />
<strong>Nacional</strong> 12.9 9.0 10.8 14.5 34.7 27.7 33.9 37.0<br />
1<br />
La pob<strong>la</strong>ción atendible en media superior refiere a aquél<strong>la</strong> con educación básica y sin media superior.<br />
Fuente: INEE, estimaciones con base en el II Conteo <strong>de</strong> Pob<strong>la</strong>ción y Vivienda 2005, Inegi.<br />
86 Contexto Social<br />
EMS_<strong>Panorama</strong>09_6-mayo-11_A.indd 86<br />
6/27/11 12:12 PM