Panorama Educativo de México 2009 - Instituto Nacional para la ...
Panorama Educativo de México 2009 - Instituto Nacional para la ...
Panorama Educativo de México 2009 - Instituto Nacional para la ...

Create successful ePaper yourself
Turn your PDF publications into a flip-book with our unique Google optimized e-Paper software.
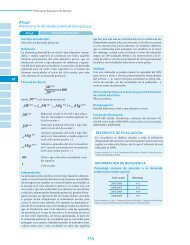
Indicadores <strong>de</strong>l Sistema <strong>Educativo</strong> <strong>Nacional</strong>. Educación Media Superior.<br />
RE02-1<br />
Porcentaje <strong>de</strong> trabajadores con contratación estable por nivel <strong>de</strong><br />
esco<strong>la</strong>ridad según grupos <strong>de</strong> edad y sexo (2008)(%)<br />
Nivel <strong>de</strong><br />
esco<strong>la</strong>ridad<br />
Grupos <strong>de</strong> edad<br />
25 - 44 años 45 - 64 años 25 - 64 años<br />
Hombres Mujeres Hombres Mujeres Total Hombres Mujeres<br />
Sin básica 21.7 ‡ 21.0 ‡ 29.6 ‡¤ 25.4 ‡ 24.2 ‡ 24.9 ‡ 22.8 ‡<br />
Básica 48.5 ‡ 49.9 ‡ 63.2 ‡ 67.2 ‡ 52.6 ‡ 51.6 ‡ 54.0 ‡<br />
Media superior 59.7 ‡ 61.1 ‡ 72.2 ‡ 76.1 ‡ 62.9 ‡ 62.4 ‡ 63.9 ‡<br />
Superior 69.7 72.8 81.2 84.4 74.0 73.2 75.1<br />
Total 45.8 ¤ 50.0 51.1 51.7 48.5 47.3 ¤ 50.4<br />
¤<br />
Diferencia entre hombres y mujeres <strong>de</strong> <strong>la</strong> misma esco<strong>la</strong>ridad, estadísticamente significativa al 95% <strong>de</strong> confianza.<br />
‡<br />
Diferencia entre niveles consecutivos <strong>de</strong> esco<strong>la</strong>ridad estadísticamente significativa al 95% <strong>de</strong> confianza.<br />
Fuente: INEE, estimaciones con base en <strong>la</strong> Encuesta <strong>Nacional</strong> <strong>de</strong> Ocupación y Empleo, 2° trimestre <strong>de</strong> 2008, Inegi.<br />
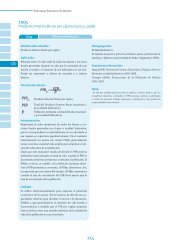
RE02-1<br />
Porcentaje <strong>de</strong> trabajadores con contratación estable por nivel <strong>de</strong><br />
esco<strong>la</strong>ridad y sexo. Edad 25-64 años. (2008)<br />
Porcentaje<br />
80<br />
73.2<br />
75.1<br />
70<br />
62.4<br />
63.9<br />
60<br />
50<br />
51.6<br />
54.0<br />
47.3<br />
50.4<br />
40<br />
30<br />
24.9<br />
22.8<br />
20<br />
Sin básica‡ Básica‡ Media superior‡ Superior T<br />
Hombres<br />
Mujeres<br />
Diferencia entre hombres y mujeres estadísticamente significativa al 95% <strong>de</strong> confianza.<br />
‡<br />
Diferencia entre niveles consecutivos <strong>de</strong> esco<strong>la</strong>ridad estadísticamente significativa al 95% <strong>de</strong> confianza.<br />
Fuente: INEE, estimaciones basadas en los microdatos <strong>de</strong> <strong>la</strong> Encuesta nacional <strong>de</strong> Ocupación y Empleo, 2º trimestre <strong>de</strong> 2008, Inegi.<br />
En todas <strong>la</strong>s entida<strong>de</strong>s fe<strong>de</strong>rativas se verifica <strong>la</strong> existencia<br />
<strong>de</strong>l mismo patrón benéfico <strong>de</strong> <strong>la</strong> esco<strong>la</strong>ridad<br />
asociada positivamente a <strong>la</strong> contratación estable,<br />
generalmente más patente <strong>para</strong> <strong>la</strong>s mujeres. En<br />
2008, <strong>la</strong>s mayores ventajas <strong>de</strong> <strong>la</strong> esco<strong>la</strong>rización entre<br />
los hombres ocurrieron en Veracruz, Hidalgo y<br />
Michoacán. Estos estados registraron diferencias<br />
en <strong>la</strong> probabilidad <strong>de</strong> contratación estable entre los<br />
más y los menos esco<strong>la</strong>rizados superiores a 60%.<br />
De manera simi<strong>la</strong>r, <strong>para</strong> el caso <strong>de</strong> <strong>la</strong>s mujeres, sobresalieron<br />
Hidalgo, Michoacán, Oaxaca, Tabasco,<br />
Guerrero y Chiapas, don<strong>de</strong> se registraron diferenciales<br />
superiores a 65% (tab<strong>la</strong> RE02-2 y RE02-A2 <strong>de</strong>l<br />
anexo electrónico).<br />
188 Resultados <strong>Educativo</strong>s<br />
EMS_<strong>Panorama</strong>09_6-mayo-11_A.indd 188<br />
6/27/11 12:12 PM