Panorama Educativo de México 2009 - Instituto Nacional para la ...
Panorama Educativo de México 2009 - Instituto Nacional para la ...
Panorama Educativo de México 2009 - Instituto Nacional para la ...

Create successful ePaper yourself
Turn your PDF publications into a flip-book with our unique Google optimized e-Paper software.
<strong>Panorama</strong> <strong>Educativo</strong> <strong>de</strong> México <strong>2009</strong><br />
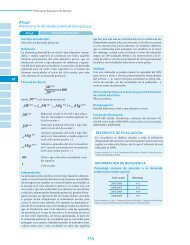
AT06-1<br />
Atención a <strong>la</strong> <strong>de</strong>manda potencial por entidad fe<strong>de</strong>rativa según sexo<br />
(2007/2008-2008/<strong>2009</strong>)<br />
AT<br />
Entidad<br />
fe<strong>de</strong>rativa<br />
2007/2008 2008/<strong>2009</strong><br />
Total Hombres Mujeres Total Hombres Mujeres<br />
Aguascalientes 85.6 85.7 85.6 85.3 84.9 85.7<br />
Baja California 86.7 86.4 86.9 86.8 86.3 87.4<br />
Baja California Sur 88.4 88.6 88.3 87.9 86.6 89.2<br />
Campeche 85.1 86.1 84.1 87.3 88.4 86.3<br />
Coahui<strong>la</strong> 92.1 93.6 90.5 83.4 84.2 82.7<br />
Colima 86.1 84.0 88.1 87.0 85.6 88.3<br />
Chiapas 85.1 84.3 85.9 84.4 84.5 84.2<br />
Chihuahua 86.9 86.7 87.1 88.1 87.4 88.8<br />
Distrito Fe<strong>de</strong>ral 93.7 94.1 93.4 93.1 92.8 93.4<br />
Durango 86.5 85.4 87.4 86.8 87.1 86.5<br />
Guanajuato 79.0 77.7 80.1 81.1 80.1 81.9<br />
Guerrero 80.5 78.1 82.7 80.6 79.6 81.5<br />
Hidalgo 80.2 78.3 81.9 81.5 80.2 82.6<br />
Jalisco 80.8 80.4 81.2 88.2 86.8 89.3<br />
México 79.4 77.8 80.9 80.7 79.4 81.9<br />
Michoacán 80.2 79.8 80.6 78.8 78.1 79.4<br />
Morelos 85.7 83.4 87.9 84.7 83.0 86.2<br />
Nayarit 87.1 84.2 89.8 83.8 82.6 84.9<br />
Nuevo León 82.2 83.5 80.8 87.2 87.4 87.0<br />
Oaxaca 81.3 79.1 83.5 83.8 83.1 84.6<br />
Pueb<strong>la</strong> 85.2 83.5 86.8 88.1 86.4 89.7<br />
Querétaro 85.0 83.7 86.2 83.1 81.8 84.2<br />
Quintana Roo 86.0 85.8 86.3 85.9 85.3 86.5<br />
San Luis Potosí 81.4 80.7 82.2 82.6 81.9 83.2<br />
Sinaloa 90.6 89.5 91.7 89.8 89.9 89.6<br />
Sonora 86.8 86.5 87.0 79.3 78.2 80.4<br />
Tabasco 88.7 88.7 88.6 89.8 89.6 89.9<br />
Tamaulipas 90.0 89.2 90.7 83.7 83.7 83.8<br />
T<strong>la</strong>xca<strong>la</strong> 86.1 85.3 86.9 83.4 82.3 84.3<br />
Veracruz 86.5 85.4 87.6 86.4 85.7 87.2<br />
Yucatán 84.4 84.2 84.5 88.0 89.0 87.0<br />
Zacatecas 85.1 84.1 85.9 82.5 81.7 83.3<br />
<strong>Nacional</strong> 84.8 84.1 85.5 85.3 84.6 85.9<br />
Fuente: INEE, estimaciones con base en Estadísticas continuas <strong>de</strong>l formato 911 (inicio <strong>de</strong> los ciclos esco<strong>la</strong>res<br />
2006/2007, 2007/2008 y 2008/<strong>2009</strong>), SEP-DGPP.<br />
Acceso y Trayectoria<br />
167<br />
EMS_<strong>Panorama</strong>09_6-mayo-11_A.indd 167<br />
6/27/11 12:12 PM