Panorama Educativo de México 2009 - Instituto Nacional para la ...
Panorama Educativo de México 2009 - Instituto Nacional para la ...
Panorama Educativo de México 2009 - Instituto Nacional para la ...

You also want an ePaper? Increase the reach of your titles
YUMPU automatically turns print PDFs into web optimized ePapers that Google loves.
Indicadores <strong>de</strong>l Sistema <strong>Educativo</strong> <strong>Nacional</strong>. Educación Media Superior.<br />
CS08-1<br />
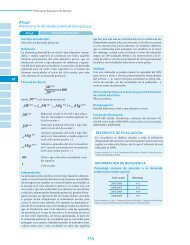
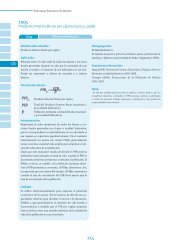
Porcentaje <strong>de</strong> <strong>la</strong> pob<strong>la</strong>ción según nivel educativo, sexo y grupos <strong>de</strong> edad<br />
seleccionados (2005)<br />
Porcentaje<br />
60.0<br />
50.0<br />
55.4 55.6<br />
40.0<br />
47.0 46.7<br />
30.0<br />
20.0<br />
10.0<br />
27.4 25.5<br />
20.1 21.4<br />
16.6<br />
23.9<br />
11.9 12.5<br />
10.4<br />
0.0.<br />
2.1 2.2<br />
Sin<br />
esco<strong>la</strong>ridad<br />
Sin<br />
básica<br />
Con<br />
básica<br />
Media<br />
superior<br />
3.4 4.3<br />
Superior<br />
Sin<br />
esco<strong>la</strong>ridad<br />
Sin<br />
básica<br />
Con<br />
básica<br />
5.7<br />
3.5<br />
Media<br />
superior<br />
4.4<br />
Superior<br />
15-24 años<br />
Hombres<br />
Mujeres<br />
55-64 años<br />
Fuente: INEE, estimaciones con base en el II Conteo <strong>de</strong> Pob<strong>la</strong>ción y Vivienda 2005, Inegi.<br />
Las cifras <strong>de</strong> 2005 también reve<strong>la</strong>n que <strong>la</strong> esco<strong>la</strong>rización<br />
ha aumentado a un ritmo más acelerado<br />
entre <strong>la</strong>s mujeres que entre los hombres. Por ello, no<br />
sorpren<strong>de</strong> que con el <strong>de</strong>venir generacional esté ocurriendo<br />
una inversión en <strong>la</strong> ten<strong>de</strong>ncia <strong>de</strong> <strong>la</strong>s brechas<br />
<strong>de</strong> esco<strong>la</strong>ridad por género, anteriormente <strong>de</strong>sfavorables<br />
a <strong>la</strong>s mujeres. Mientras en el grupo <strong>de</strong> 55 a 64<br />
años el porcentaje <strong>de</strong> hombres con educación superior<br />
rebasaba al <strong>de</strong> <strong>la</strong>s mujeres por más <strong>de</strong> 6 puntos<br />
porcentuales, en el grupo <strong>de</strong> menor edad entre los<br />
examinados, 15 a 24 años, dicho porcentaje fue inferior<br />
al <strong>de</strong> <strong>la</strong>s mujeres por casi un punto porcentual<br />
(gráfica CS08-1).<br />
esa situación. Consistentemente, estas mismas entida<strong>de</strong>s<br />
concentraron los mayores porcentajes <strong>de</strong><br />
pob<strong>la</strong>ción con esco<strong>la</strong>ridad superior (gráfica CS08-2).<br />
Sobresalió el Distrito Fe<strong>de</strong>ral porque 24.8% y 19.2%<br />
<strong>de</strong> sus hombres y mujeres, respectivamente, habían<br />
completado, por lo menos, <strong>la</strong> licenciatura.<br />
La tab<strong>la</strong> CS08-2 muestra <strong>la</strong> estructura <strong>de</strong> esco<strong>la</strong>rización<br />
<strong>para</strong> el grupo <strong>de</strong> 25 a 64 años por entidad<br />
fe<strong>de</strong>rativa. El Distrito Fe<strong>de</strong>ral, Nuevo León y Coahui<strong>la</strong><br />
se distinguieron por ser <strong>la</strong>s entida<strong>de</strong>s con los niveles<br />
<strong>de</strong> esco<strong>la</strong>rización más favorables <strong>para</strong> <strong>la</strong> educación<br />
<strong>de</strong> <strong>la</strong>s generaciones jóvenes, reflejo <strong>de</strong> <strong>la</strong><br />
mayor preocupación en sus socieda<strong>de</strong>s por instruir<br />
a su pob<strong>la</strong>ción; en contraste, Chiapas, Guerrero<br />
y Oaxaca sobresalieron por lo contrario. El primer<br />
conjunto <strong>de</strong> estados registraron los menores porcentajes<br />
<strong>de</strong> pob<strong>la</strong>ción en situación <strong>de</strong> máximo<br />
atraso educativo, aquél<strong>la</strong> sin esco<strong>la</strong>rización; a lo<br />
más, 3% <strong>de</strong> hombres y mujeres se encontraban en<br />
104 Contexto Social<br />
EMS_<strong>Panorama</strong>09_6-mayo-11_A.indd 104<br />
6/27/11 12:12 PM