Panorama Educativo de México 2009 - Instituto Nacional para la ...
Panorama Educativo de México 2009 - Instituto Nacional para la ...
Panorama Educativo de México 2009 - Instituto Nacional para la ...

You also want an ePaper? Increase the reach of your titles
YUMPU automatically turns print PDFs into web optimized ePapers that Google loves.
<strong>Panorama</strong> <strong>Educativo</strong> <strong>de</strong> México <strong>2009</strong><br />
RE03-1<br />
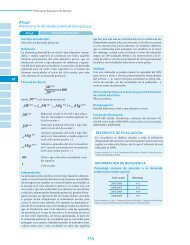
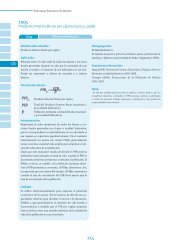
Porcentaje <strong>de</strong> ganancia o pérdida sa<strong>la</strong>rial horaria re<strong>la</strong>tiva <strong>de</strong> los<br />
trabajadores <strong>de</strong> 25 a 64 años, respecto a media superior<br />
por nivel <strong>de</strong> esco<strong>la</strong>ridad y sexo (2008)<br />
RE<br />
100.0<br />
Porcentaje<br />
87.3<br />
80.0<br />
75.9<br />
60.0<br />
61.2<br />
Ganancia<br />
40.0<br />
20.0<br />
Perdida<br />
0.0<br />
Sin básica<br />
Básica<br />
Superior<br />
-20.0<br />
-21.9<br />
-21.4<br />
-21.6<br />
-40.0<br />
-38.8<br />
-45.6<br />
-41.3<br />
-60.0<br />
Hombres Mujeres Total<br />
Fuente: INEE, estimaciones a partir <strong>de</strong> <strong>la</strong> Encuesta <strong>Nacional</strong> <strong>de</strong> Ocupación y Empleo, 2° trimestre <strong>de</strong> 2008, Inegi.<br />
El patrón <strong>de</strong> beneficios sa<strong>la</strong>riales asociados a <strong>la</strong> esco<strong>la</strong>ridad<br />
se conserva a nivel <strong>de</strong> <strong>la</strong>s entida<strong>de</strong>s con<br />
algunos matices. Por ejemplo, <strong>para</strong> el caso <strong>de</strong> los<br />
hombres, <strong>la</strong> gráfica RE03-2 muestra que, en 2008,<br />
el Distrito Fe<strong>de</strong>ral, Querétaro, Yucatán, Chiapas y<br />
Zacatecas fueron estados don<strong>de</strong> <strong>la</strong> diferencia entre<br />
tener educación superior y media superior significó<br />
percepciones sa<strong>la</strong>riales por arriba <strong>de</strong>l doble. En<br />
cambio, Baja California Sur, Colima, Nayarit y Sonora<br />
se distinguieron porque en el<strong>la</strong>s tales diferencias no<br />
llegaron a 60 por ciento.<br />
El análisis <strong>de</strong> los sa<strong>la</strong>rios promedio también confirma<br />
<strong>la</strong>s ventajas que tienen los trabajadores al<br />
avanzar hacia niveles superiores <strong>de</strong> esco<strong>la</strong>ridad. Por<br />
ejemplo, quienes, en 2008, habían alcanzado el nivel<br />
superior recibieron en promedio alre<strong>de</strong>dor <strong>de</strong><br />
34 ó 40 pesos más por hora trabajada que sus pares<br />
mujeres u hombres sin básica <strong>de</strong> 25-64 años <strong>de</strong><br />
edad, respectivamente (tab<strong>la</strong> RE03-2 y RE03-A1 <strong>de</strong>l<br />
anexo electrónico).<br />
Resultados <strong>Educativo</strong>s<br />
191<br />
EMS_<strong>Panorama</strong>09_6-mayo-11_A.indd 191<br />
6/27/11 12:12 PM