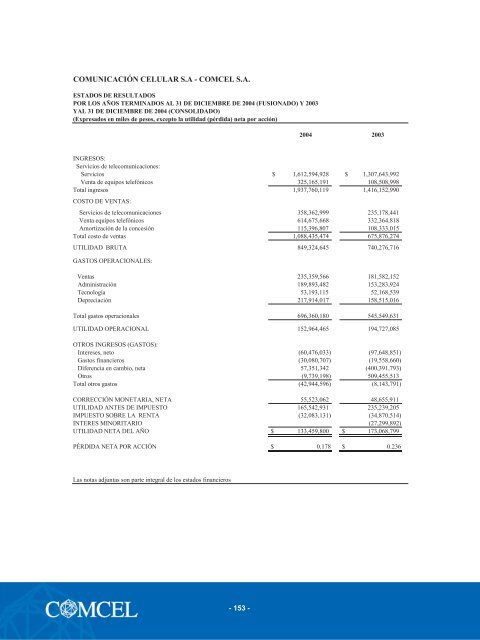
COMUNICACIÓN CELULAR S.A - COMCEL S.A.ESTADOS DE RESULTADOSPOR LOS AÑOS TERMINADOS AL 31 DE DICIEMBRE DE 2004 (FUSIONADO) Y 2003YAL 31 DE DICIEMBRE DE 2004 (CONSOLIDADO)(Expresados en miles de pesos, excepto la utilidad (pérdida) neta por acción)2004 2003INGRESOS:Servicios de telecomunicaciones:Servicios $ 1,612,594,928 $ 1,307,643,992Venta de equipos telefónicos 325,165,191 108,508,998Total ingresos 1,937,760,119 1,416,152,990COSTO DE VENTAS:Servicios de telecomunicaciones 358,362,999 235,178,441Venta equipos telefónicos 614,675,668 332,364,818Amortización de la concesión 115,396,807 108,333,015Total costo de ventas 1,088,435,474 675,876,274UTILIDAD BRUTA 849,324,645 740,276,716GASTOS OPERACIONALES:Ventas 235,359,566 181,582,152Administración 189,893,482 153,283,924Tecnología 53,193,115 52,168,539Depreciación 217,914,017 158,515,016Total gastos operacionales 696,360,180 545,549,631UTILIDAD OPERACIONAL 152,964,465 194,727,085OTROS INGRESOS (GASTOS):Intereses, neto (60,476,033) (97,648,851)Gastos financieros (30,080,707) (19,558,660)Diferencia en cambio, neta 57,351,342 (400,391,793)Otros (9,739,198) 509,455,513Total otros gastos (42,944,596) (8,143,791)CORRECCIÓN MONETARIA, NETA 55,523,062 48,655,911UTILIDAD ANTES DE IMPUESTO 165,542,931 235,239,205IMPUESTO SOBRE LA RENTA (32,083,131) (34,870,514)INTERES MINORITARIO (27,299,892)UTILIDAD NETA DEL AÑO $ 133,459,800 $ 173,068,799PÉRDIDA NETA POR ACCIÓN $ 0.178 $ 0.236Las notas adjuntas son parte integral de los estados financieros749,967,640 731,938,115- 153 -
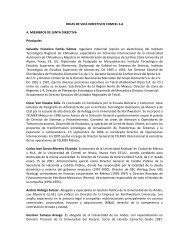
27. CERTIFICACIÓN DE LOS ESTADOS FINANCIEROSLos suscritos Representante Legal y Contador Público bajo cuya responsabilidad se prepararon los estados financieros,certificamos:Que para la emisión de los balances generales, al 31 de diciembre de 2004 y 2003, y de los estados de resultados,de cambios en el patrimonio, de cambios en la situación financiera y de flujos de efectivo, por los años terminadosen esas fechas, que conforme al reglamento se ponen a disposición de los accionistas y de terceros, se han verificadopreviamente las afirmaciones contenidas en ellos y las cifras tomadas fielmente de los libros.Dichas afirmaciones, explícitas e implícitas, son las siguientes:Existencia: Los activos y pasivos de Comunicación Celular S.A. <strong>Comcel</strong> S.A. existen en la fecha de corte y las transaccionesregistradas se han realizado durante el año.Integridad: Todos los hechos económicos realizados han sido reconocidos.Derechos y obligaciones: Los activos representan probables beneficios económicos futuros y los pasivos representanprobables sacrificios económicos futuros, obtenidos o a cargo de Comunicación Celular S.A. - <strong>Comcel</strong> S.A. en la fechade corte.Valuación: Todos los elementos han sido reconocidos por importes apropiados.Presentación y revelación: Los hechos económicos han sido correctamente clasificados, descritos y revelados.Adrián HernándezPresidenteCarlos Augusto GiraldoContadorTarjeta Profesional 8711-TBogotá, D.C., Colombia1 de febrero de 2005.- 154 -
- Page 1 and 2:
Prospecto de Colocación de Papeles
- Page 3 and 4:
3.3.5 Clientes y Distribución ....
- Page 5 and 6:
eliminando el riesgo de su manejo f
- Page 7 and 8:
Tasa de Interés EfectivaTasa de In
- Page 9 and 10:
MGWMSCMSSMTSOPCSPenetraciónPOPsPOP
- Page 11 and 12:
ser adquiridos y negociados por los
- Page 13 and 14:
originalmente por parte del inversi
- Page 15 and 16:
* En caso de primaPrecio = Valor No
- Page 17 and 18:
del primer Aviso de Oferta; tratán
- Page 19 and 20:
(v) El saldo en circulación bajo e
- Page 21 and 22:
tiempo. Es de esperarse que el marg
- Page 23 and 24:
2.2 Mecanismo de Subastaa. El mecan
- Page 25 and 26:
3 Información General del Emisor -
- Page 27 and 28:
el ochenta y cinco por ciento (85%)
- Page 29 and 30:
113 Este es un servicio el cuál le
- Page 31 and 32:
un sistema de correo de voz (Plataf
- Page 33 and 34:
El contrato de concesión incluye u
- Page 35 and 36:
3.4 Aspectos Administrativos3.4.1 E
- Page 37 and 38:
Los principales directivos de la co
- Page 39 and 40:
En materia de selección está impl
- Page 41 and 42:
Por esta licencia, COMCEL S.A. canc
- Page 43 and 44:
UN AMIGO CON QUIENHABLAR (Lema Come
- Page 45 and 46:
Los Estados Financieros de COMCEL a
- Page 47 and 48:
Los fondos provenientes de la emisi
- Page 49 and 50:
Salvo determinación en contrario,
- Page 51 and 52:
El costo de los equipos celulares e
- Page 53 and 54:
p) Provisión para impuesto sobre l
- Page 55 and 56:
Guatemala ACT* celular, fijo 99.1%
- Page 57 and 58:
adquirió la participación de SBC
- Page 59 and 60:
5 Anexos5.1 Calificación otorgada
- Page 61 and 62:
Por otro lado, el crecimiento de la
- Page 63 and 64:
PerfilComcel inició operaciones en
- Page 65 and 66:
contaba con 127 CPSs, en el 2004, c
- Page 67 and 68:
Perfil FinancieroEstado de Resultad
- Page 69 and 70:
concepto de intereses y el cargo po
- Page 71 and 72:
apalancamiento y el pasivo pasó a
- Page 73 and 74:
Original FirmadoOriginal Firmado- 7
- Page 75 and 76:
COMUNICACIÓN CELULAR S.A. - COMCEL
- Page 77 and 78:
COMUNICACIÓN CELULAR S.A - COMCEL
- Page 79 and 80:
COMUNICACIÓN CELULAR S.A - COMCEL
- Page 81 and 82:
COMUNICACIÓN CELULAR S.A. - COMCEL
- Page 83 and 84:
AñosConstrucciones y edificaciones
- Page 85 and 86:
5. DEUDORES, NETO2005 2004Clientes
- Page 87 and 88:
10. CARGOS DIFERIDOS, NETO2005 2004
- Page 89 and 90:
15. IMPUESTOS, GRAVAMENES Y TASASDu
- Page 91 and 92:
17. ACTIVOS Y PASIVOS EN MONEDA EXT
- Page 93 and 94:
La Junta Directiva de Comunicación
- Page 95 and 96:
(1) Incluye provisión para conting
- Page 97 and 98:
Estado actual del proceso: se está
- Page 99 and 100:
COMUNICACIÓN CELULAR S.A.BALANCES
- Page 101 and 102:
COMUNICACIÓN CELULAR S.A - COMCEL
- Page 103 and 104: COMUNICACIÓN CELULAR S.A - COMCEL
- Page 105 and 106: COMUNICACIÓN CELULAR S.A. - COMCEL
- Page 107 and 108: l) Intangibles, neto.Los costos dir
- Page 109 and 110: 5. DEUDORES, NETO2005 2004Clientes
- Page 111 and 112: (1) Valor correspondiente a derecho
- Page 113 and 114: 13. PROVEEDORES Y CUENTAS POR PAGAR
- Page 115 and 116: 2005 2004Patrimonio fiscal líquido
- Page 117 and 118: Deudoras 2005 2004Empresa de Teléf
- Page 119 and 120: 19. CUENTAS DE ORDEN2005 2004Deudor
- Page 121 and 122: Tribunal de Arbitramento de Celcent
- Page 123: Espacio en Blanco- 122 -
- Page 127 and 128: COMUNICACIÓN CELULAR S.A - COMCEL
- Page 129 and 130: COMUNICACIÓN CELULAR S.A.- COMCEL
- Page 131 and 132: COMUNICACIÓN CELULAR S.A. - COMCEL
- Page 133 and 134: e) Provisión para deudores - Repre
- Page 135 and 136: Estos instrumentos no se utilizan c
- Page 137 and 138: 4. DEUDORES, NETOClientes $ 167,947
- Page 139 and 140: (1) Durante 1998 y 2003 se firmaron
- Page 141 and 142: 8. PROPIEDAD, PLANTA Y EQUIPO, NETO
- Page 143 and 144: 13. OBLIGACIONES FINANCIERASCorto p
- Page 145 and 146: Ocurrencia Expiración Total pérdi
- Page 147 and 148: 17. PATRIMONIOCapital - Al 31 de di
- Page 149 and 150: 20. OTROS INGRESOS (GASTOS) - OTROS
- Page 151 and 152: debían pagar cada uno una multa de
- Page 153: COMUNICACIÓN CELULAR S.A. - COMCEL
- Page 157 and 158: - 156 -
- Page 159 and 160: posee más del 10% de las acciones
- Page 161 and 162: - 160 -
- Page 163 and 164: - 162 -
- Page 165 and 166: - 164 -
- Page 167 and 168: CONTINUA- 166 -
- Page 169 and 170: 6 Certificaciones6.1 Concepto de Ve