<strong>de</strong> TEUs y <strong>de</strong> un rendimiento operativo <strong>de</strong> 5 contenedores/hora a 45 contenedores/hora (posición #6 <strong>de</strong>lranking).Asimismo, también ha recibido numerosos premios a la calidad y exc<strong>el</strong>encia portuaria por la CaribbeanShipping Association como ―Mejor Terminal <strong>de</strong> Contenedores <strong>de</strong>l Caribe‖, entre otros más 41 . También se<strong>de</strong>staca la gestión <strong>de</strong>l Recurso Humano enfocada a <strong>de</strong>sarrollar, motivar y retener las mejores personas,para apoyar <strong>el</strong> crecimiento y competitividad <strong>de</strong> la organización, por lo que se estimula la exc<strong>el</strong>encia en <strong>el</strong><strong>de</strong>sempeño, forjar la cultura organizacional y <strong>de</strong>sarrollar comportamientos que aseguren la permanentecreación <strong>de</strong> valor <strong>de</strong> la empresa y <strong>de</strong> las personas que hacen parte <strong>de</strong> <strong>el</strong>la. El talento y competencias <strong>de</strong>quienes integran <strong>el</strong> Puerto, se <strong>de</strong>sarrolla a través <strong>de</strong> procesos <strong>de</strong> capacitación y entrenamiento, Gestión<strong>de</strong>l Desarrollo, Desarrollo y Gestión <strong>de</strong>l Conocimiento los cuales se fundamentan en la estrategia <strong>de</strong> laorganización, sus procesos claves, <strong>de</strong>sarrollo <strong>de</strong> potenciales y los planes <strong>de</strong> mejoramiento continuo. 42 Otro ejemplo es <strong>el</strong> Puerto Buenaventura (posición #20), <strong>el</strong> cual fue concesionado <strong>el</strong> 17 <strong>de</strong> marzo <strong>de</strong> 1994a la Sociedad Portuaria Regional <strong>de</strong> Buenaventura, logrando multiplicar por 3 <strong>el</strong> movimiento <strong>de</strong>contenedores entre 1999 y 2010.TABLA 14 ACTIVIDAD PORTUARIA EN AMERICA LATINA, 2008-2010RNKPAIS/Var.2010 PUERTO/ PORTCOUNTRY TEU 2008 TEU 2009 TEU 2010 2010/091 Colón (MIT, Evergreen, Panamá Panamá 2.468.520 2.210.720 2.810.657 (p) 27,1%Port)2 Balboa Panamá 2.167.977 2.011.778 2.758.506 (p) 37,1%3 Santos Brasil 2.677.839 2.255.862 2.715.568 20,4%4 Kingston Jamaica 1.915.951 1.728.042 1.891.770 9,5%5 Buenos Aires (incluye Exolgan) Argentina 1.781.100 1.412.462 1.730.831 22,5%6 Cartagena (inc. S.P.R, El Bosque, Colombia 1.064.105 1.237.873 1.581.401 27,8%Contecar,ZP)7 Manzanillo México 1.409.782 1.110.356 1.509.378 35,9%8 Callao Perú 1.203.315 1.089.838 1.346.186 23,5%9 Guayaquil Ecuador 874.955 884.100 1.093.349 23,7%10 Freeport Bahamas 1.702.000 1.297.000 1.081.000 (e) -16,7%11 Caucedo República 736.879 906.279 1.004.901 10,9%Dominicana12 Itajai (inc.Navegantes) Brasil 693.580 593.359 957.130 61,3%13 Valparaíso Chile 946.921 677.432 878.787 29,7%14 San Antonio Chile 687.864 729.033 870.719 19,4%15 Limón-Moin Costa Rica 835.143 748.029 858.176 14,7%16 Lázaro Cár<strong>de</strong>nas México 524.791 591.467 796.011 34,6%17 Puerto Cab<strong>el</strong>lo Venezu<strong>el</strong>a 809.454 790.000 ... ...41Tomado <strong>de</strong> la pagina WEB <strong>de</strong>l Puerto Cartagena:http://albatros.puertocartagena.com/opadmco.nsf/vstRefLinkDoc/73B6AF55BBFB2420052573B50077CED642Tomado <strong>de</strong> la pagina WEB <strong>de</strong>l Puerto Cartagena:http://albatros.puertocartagena.com/opadmco.nsf/vstRefLinkDoc/A9B4DA08C89C7057052573B500724E7974
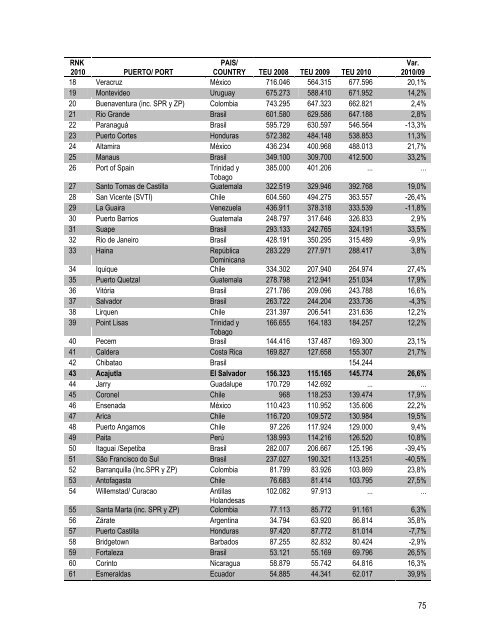
RNK2010 PUERTO/ PORTPAIS/COUNTRY TEU 2008 TEU 2009 TEU 2010Var.2010/0918 Veracruz México 716.046 564.315 677.596 20,1%19 Montevi<strong>de</strong>o Uruguay 675.273 588.410 671.952 14,2%20 Buenaventura (inc. SPR y ZP) Colombia 743.295 647.323 662.821 2,4%21 Rio Gran<strong>de</strong> Brasil 601.580 629.586 647.188 2,8%22 Paranaguá Brasil 595.729 630.597 546.564 -13,3%23 Puerto Cortes Honduras 572.382 484.148 538.853 11,3%24 Altamira México 436.234 400.968 488.013 21,7%25 Manaus Brasil 349.100 309.700 412.500 33,2%26 Port of Spain Trinidad y 385.000 401.206 ... ...Tobago27 Santo Tomas <strong>de</strong> Castilla Guatemala 322.519 329.946 392.768 19,0%28 San Vicente (SVTI) Chile 604.560 494.275 363.557 -26,4%29 La Guaira Venezu<strong>el</strong>a 436.911 378.318 333.539 -11,8%30 Puerto Barrios Guatemala 248.797 317.646 326.833 2,9%31 Suape Brasil 293.133 242.765 324.191 33,5%32 Rio <strong>de</strong> Janeiro Brasil 428.191 350.295 315.489 -9,9%33 Haina República 283.229 277.971 288.417 3,8%Dominicana34 Iquique Chile 334.302 207.940 264.974 27,4%35 Puerto Quetzal Guatemala 278.798 212.941 251.034 17,9%36 Vitória Brasil 271.786 209.096 243.788 16,6%37 Salvador Brasil 263.722 244.204 233.736 -4,3%38 Lirquen Chile 231.397 206.541 231.636 12,2%39 Point Lisas Trinidad y 166.655 164.183 184.257 12,2%Tobago40 Pecem Brasil 144.416 137.487 169.300 23,1%41 Cal<strong>de</strong>ra Costa Rica 169.827 127.658 155.307 21,7%42 Chibatao Brasil 154.24443 Acajutla El Salvador 156.323 115.165 145.774 26,6%44 Jarry Guadalupe 170.729 142.692 ... ...45 Coron<strong>el</strong> Chile 968 118.253 139.474 17,9%46 Ensenada México 110.423 110.952 135.606 22,2%47 Arica Chile 116.720 109.572 130.984 19,5%48 Puerto Angamos Chile 97.226 117.924 129.000 9,4%49 Paita Perú 138.993 114.216 126.520 10,8%50 Itaguai /Sepetiba Brasil 282.007 206.667 125.196 -39,4%51 Sâo Francisco do Sul Brasil 237.027 190.321 113.251 -40,5%52 Barranquilla (Inc.SPR y ZP) Colombia 81.799 83.926 103.869 23,8%53 Antofagasta Chile 76.683 81.414 103.795 27,5%54 Willemstad/ Curacao Antillas102.082 97.913 ... ...Holan<strong>de</strong>sas55 Santa Marta (inc. SPR y ZP) Colombia 77.113 85.772 91.161 6,3%56 Zárate Argentina 34.794 63.920 86.814 35,8%57 Puerto Castilla Honduras 97.420 87.772 81.014 -7,7%58 Bridgetown Barbados 87.255 82.832 80.424 -2,9%59 Fortaleza Brasil 53.121 55.169 69.796 26,5%60 Corinto Nicaragua 58.879 55.742 64.816 16,3%61 Esmeraldas Ecuador 54.885 44.341 62.017 39,9%75
- Page 1 and 2:
UNIVERSIDAD DE EL SALVADORFacultad
- Page 3:
DEDICATORIASEn Primer lugar agradec
- Page 6 and 7:
3.7 PROYECTOS DE INVERSIÓN CON PAR
- Page 8 and 9:
ÍNDICE DE GRAFICOSGRAFICO 1 DINÁM
- Page 10 and 11:
En consecuencia a lo anterior, es n
- Page 12 and 13:
la que apenas se ha comenzado a teo
- Page 14 and 15:
1.1 ANTECEDENTES SOBRE LA INTERVENC
- Page 16 and 17:
educción de la participación esta
- Page 18 and 19:
1.1.5 LAS REFORMAS LEGALES PARA INC
- Page 20 and 21:
elegidas tres) 6 ; revisión de emi
- Page 22 and 23:
Considerando que dicho puerto está
- Page 24 and 25:
Manzanillo - México creció el 17.
- Page 26 and 27:
Norteamérica; además de convertir
- Page 28 and 29:
• Leyes,El método utilizado ser
- Page 30 and 31:
CAPITULO II:MARCO TEÓRICO18
- Page 32 and 33:
2.1.1 GLOBALIZACIÓN Y TRATADOS DE
- Page 34 and 35:
soberana propiedad del gobierno de
- Page 36 and 37: ArgentinaBahamasBrasilCanadáChileR
- Page 38 and 39: ) Puertos Industriales: aquellos cu
- Page 40 and 41: 3. Gran puerto regional: Un puerto
- Page 42 and 43: de seguridad ya que en muchos país
- Page 44 and 45: Esta nueva naturaleza promueve las
- Page 46 and 47: TIPOLOGIAS DE LOS PUERTOS EN EUROPA
- Page 48 and 49: TABLA 5 INVERSIÓN PÚBLICA Y TRÁF
- Page 50 and 51: TABLA 6: REFORMAS LLEVADAS EN AMÉR
- Page 52 and 53: lugar, la privatización es mucho m
- Page 54 and 55: PAÍSMODELOS DESITUACION DE LOS PUE
- Page 56 and 57: ILUSTRACIÓN 4 PUERTOS A NIVEL CENT
- Page 58 and 59: 10.1%Reino Unido10.5%EUA11.4%Japón
- Page 60: instrumentos reguladores, penalizac
- Page 63 and 64: Del análisis realizado conforme a
- Page 65 and 66: 2.8 MÉTODOS EXISTENTES PARA PRIVAT
- Page 67 and 68: ESQUEMATICAMENTE DICHA PARTICIPACI
- Page 69 and 70: Actividades portuarias de 1ª gener
- Page 71 and 72: 2.10 COMPARACION DEL MODELO TRADICI
- Page 73 and 74: f) La recepción, entrega transport
- Page 75 and 76: EQUIPO PORTUARIOPara la Ejecución
- Page 77 and 78: MILES DE TM1,1931,2671,3011,5031,87
- Page 79 and 80: BENEFICIOS SOCIALES Y ECONÓMICOS E
- Page 81 and 82: CAPITULO III:LOS MODELOS DE PARTICI
- Page 83 and 84: internacionales; por lo que el Gobi
- Page 85: ILUSTRACIÓN 8 PRESENCIA DE OPERADO
- Page 89 and 90: RNK2010 PUERTO/ PORTPAIS/COUNTRY TE
- Page 91 and 92: TABLA 15 OBJETIVOS DEL GOBIERNO DE
- Page 93 and 94: Es de destacar además, que ante lo
- Page 95 and 96: portuaria, conjuntamente con el der
- Page 97 and 98: LEY REGULADORA:Es importante una bu
- Page 99 and 100: TABLA 16 EVALUACIÓN DE OPCIONES PA
- Page 101 and 102: 3.6 EVALUACIÓN DE MERCADOHa consis
- Page 103 and 104: Este de Asia y el Pacifico (East As
- Page 105 and 106: PAÍSNOMBRE DELPROYECTOHighwayESTAT
- Page 107 and 108: 4.1 METODOLOGIA UTILIZADA PARA LA S
- Page 109 and 110: El gobierno deberá estar preparado
- Page 111 and 112: En la actividad portuaria hay tres
- Page 113 and 114: • Compromiso de iniciar operacion
- Page 115 and 116: TABLA 20 REQUISITOS DE DOCUMENTACI
- Page 117 and 118: Puntajes que define el gobierno, se
- Page 119 and 120: 4.2. Describir Inversiones Mandatar
- Page 121 and 122: El puntaje que se le asignará a lo
- Page 123 and 124: TABLA 24 EVALUACIÓN DE PUNTAJES Y
- Page 125 and 126: d. El concesionario recibe una remu
- Page 127 and 128: Debido a que es imposible prever en
- Page 129 and 130: a. Condiciones para rescindirb. Mul
- Page 132 and 133: VIENEDEHOJA 1...ENTREGAEINICIODEOPE
- Page 134 and 135: CAPITULO VBENEFICIOS AL INCORPORAR
- Page 136 and 137:
5.1.2 INVERSIONES EN INFRAESTRUCTUR
- Page 138 and 139:
5.2 INVERSIÓN REALIZADAS Y PROYECT
- Page 140 and 141:
MILLONES DE US$Como puede observars
- Page 142 and 143:
TABLA 30 PROYECTOS DE INFRAESTRUCTU
- Page 144 and 145:
MILES DE TEU'S5.6 COMPARACION DE MO
- Page 146 and 147:
Como se observa, a partir del año
- Page 148 and 149:
CONCLUSIONES• Las concesiones (qu
- Page 150 and 151:
• Subcontratación de servicios p
- Page 152 and 153:
entonces se verá cómo. Estos comp
- Page 154 and 155:
de la carga a un costo razonable. E
- Page 156 and 157:
• http://www.oas.org/cip/docs/are
- Page 158 and 159:
• Build-Operate-Transfer (BOT). E
- Page 160 and 161:
estrategia de delegación: contrato
- Page 162 and 163:
plataformas fijas o flotantes para
- Page 164 and 165:
• Zona de Actividades Logísticas
- Page 166 and 167:
ANEXO 1 EJEMPLO DE CRITERIOS DE PRE
- Page 168 and 169:
Tasa de Crecimiento (%)1950-541955-
- Page 170 and 171:
ANEXO 5 ÉXITO CHILENO EN EL TEMA D
- Page 172 and 173:
En infraestructura vial, donde se d
- Page 174:
PROYECTOS CHILENOS EN CIFRASProyect