SITUACION DEL EMPLEO EN TIEMPOS DE CAMBIOreportan que su trabajo las ocupa por jornadas que están muy por <strong>de</strong>bajo<strong>de</strong> su disponibilidad. Estas características se verifican <strong>en</strong> el conjunto <strong><strong>de</strong>l</strong>as ciuda<strong>de</strong>s, sin embargo es <strong>en</strong> La Paz y El Alto don<strong>de</strong> el porc<strong>en</strong>taje <strong>de</strong>subempleados <strong>en</strong> estas categorías ocupacionales es extremadam<strong>en</strong>te alto(Cuadro 29) 17 .En el otro extremo –y como era <strong>de</strong> esperar por los <strong>cambio</strong>sobservados <strong>en</strong> la jornada laboral efectiva– los asalariados (obreros,empleados, empleados <strong><strong>de</strong>l</strong> hogar), pres<strong>en</strong>tan tasas <strong>de</strong> subempleo inferioresal promedio, <strong>en</strong> particular, los obreros (<strong>en</strong>tre qui<strong>en</strong>es el subempleo visiblellega a 3,2%). Esto no hace más que ratificar lo señalado, respecto a quecon la pl<strong>en</strong>a vig<strong>en</strong>cia <strong>de</strong> las políticas <strong>de</strong> flexibilidad laboral, el subempleohorario <strong>en</strong>tre los asalariados no se manifiesta como un “déficit” sino como“un exceso” <strong>de</strong> horas <strong>de</strong> trabajo; es <strong>de</strong>cir, <strong>en</strong> jornadas sin fin que han<strong>de</strong>jado atrás las conquistas sociales <strong>de</strong> los trabajadores por las ocho horas<strong>de</strong> trabajo.Cuadro 29Subempleo visible según categoría ocupacional y sexo, 2008(En porc<strong>en</strong>taje)Subempleo visible Total Hombre MujerTotal 9,1 5,9 13,1Obrero 3,6 3,2 6,5Empleado 5,2 4,5 6,0Trabajador por cu<strong>en</strong>ta propia (in<strong>de</strong>p.) 13,0 7,1 17,5Profesional in<strong>de</strong>p<strong>en</strong>di<strong>en</strong>te 7,5 3,9 12,7Dueño, socio o empleador 4,4 3,0 8,3Trabajador familiar sin remuneración 24,0 23,6 24,2Empleada(o) <strong><strong>de</strong>l</strong> hogar 7,5 40,1 7,0Fu<strong>en</strong>te: ECEDLA, 200817 Las tasas <strong>de</strong> subempleo por ciuda<strong>de</strong>s y sexo se pres<strong>en</strong>tan <strong>en</strong> el cuadro 1 <strong><strong>de</strong>l</strong> Anexo 151
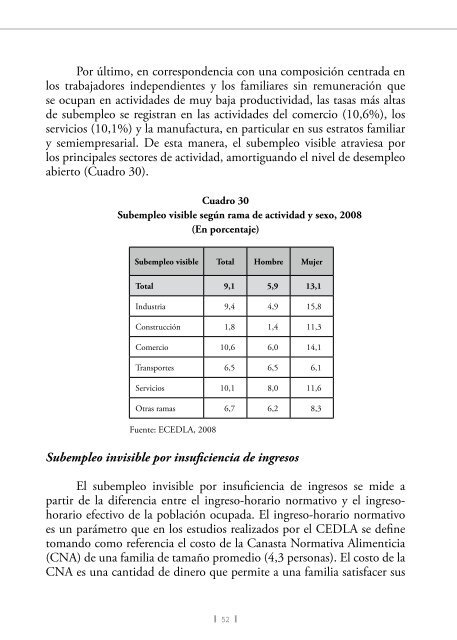
Por último, <strong>en</strong> correspond<strong>en</strong>cia con una composición c<strong>en</strong>trada <strong>en</strong>los trabajadores in<strong>de</strong>p<strong>en</strong>di<strong>en</strong>tes y los familiares sin remuneración quese ocupan <strong>en</strong> activida<strong>de</strong>s <strong>de</strong> muy baja productividad, las tasas más altas<strong>de</strong> subempleo se registran <strong>en</strong> las activida<strong>de</strong>s <strong><strong>de</strong>l</strong> comercio (10,6%), losservicios (10,1%) y la manufactura, <strong>en</strong> particular <strong>en</strong> sus estratos familiary semiempresarial. De esta manera, el subempleo visible atraviesa porlos principales sectores <strong>de</strong> actividad, amortiguando el nivel <strong>de</strong> <strong>de</strong>sempleoabierto (Cuadro 30).Cuadro 30Subempleo visible según rama <strong>de</strong> actividad y sexo, 2008(En porc<strong>en</strong>taje)Subempleo visible Total Hombre MujerTotal 9,1 5,9 13,1Industria 9,4 4,9 15,8Construcción 1,8 1,4 11,3Comercio 10,6 6,0 14,1Transportes 6,5 6,5 6,1Servicios 10,1 8,0 11,6Otras ramas 6,7 6,2 8,3Fu<strong>en</strong>te: ECEDLA, 2008Subempleo invisible por insufici<strong>en</strong>cia <strong>de</strong> ingresosEl subempleo invisible por insufici<strong>en</strong>cia <strong>de</strong> ingresos se mi<strong>de</strong> apartir <strong>de</strong> la difer<strong>en</strong>cia <strong>en</strong>tre el ingreso-horario normativo y el ingresohorarioefectivo <strong>de</strong> la población ocupada. El ingreso-horario normativoes un parámetro que <strong>en</strong> los estudios realizados por el CEDLA se <strong>de</strong>finetomando como refer<strong>en</strong>cia el costo <strong>de</strong> la Canasta Normativa Alim<strong>en</strong>ticia(CNA) <strong>de</strong> una familia <strong>de</strong> tamaño promedio (4,3 personas). El costo <strong>de</strong> laCNA es una cantidad <strong>de</strong> dinero que permite a una familia satisfacer sus52
- Page 2 and 3:
Situación del Empleoen tiempos dec
- Page 4 and 5:
Situación del Empleoen tiempos dec
- Page 6 and 7:
PRESENTACIÓNEl empleo -visto en el
- Page 8 and 9: INTRODUCCIÓNLos principales indica
- Page 10 and 11: PRINCIPALES TENDENCIASECONÓMICAS Y
- Page 12 and 13: SITUACION DEL EMPLEO EN TIEMPOS DE
- Page 14 and 15: SITUACION DEL EMPLEO EN TIEMPOS DE
- Page 16 and 17: SITUACION DEL EMPLEO EN TIEMPOS DE
- Page 18 and 19: SITUACION DEL EMPLEO EN TIEMPOS DE
- Page 20: SITUACION DEL EMPLEO EN TIEMPOS DE
- Page 23 and 24: Cuadro 6Bolivia: Crecimiento del pr
- Page 25 and 26: Vista la relación entre la expansi
- Page 27 and 28: la persistencia de una elevada tasa
- Page 29 and 30: y mayor crecimiento del producto, p
- Page 32 and 33: SITUACION DEL EMPLEO EN TIEMPOS DE
- Page 34 and 35: SITUACION DEL EMPLEO EN TIEMPOS DE
- Page 36 and 37: SITUACION DEL EMPLEO EN TIEMPOS DE
- Page 38 and 39: SITUACION DEL EMPLEO EN TIEMPOS DE
- Page 40 and 41: SITUACION DEL EMPLEO EN TIEMPOS DE
- Page 42 and 43: SITUACION DEL EMPLEO EN TIEMPOS DE
- Page 44 and 45: SITUACION DEL EMPLEO EN TIEMPOS DE
- Page 46 and 47: SITUACION DEL EMPLEO EN TIEMPOS DE
- Page 48 and 49: SITUACION DEL EMPLEO EN TIEMPOS DE
- Page 50 and 51: SITUACION DEL EMPLEO EN TIEMPOS DE
- Page 52 and 53: SITUACION DEL EMPLEO EN TIEMPOS DE
- Page 54 and 55: SITUACION DEL EMPLEO EN TIEMPOS DE
- Page 56 and 57: SITUACION DEL EMPLEO EN TIEMPOS DE
- Page 60 and 61: SITUACION DEL EMPLEO EN TIEMPOS DE
- Page 62 and 63: SITUACION DEL EMPLEO EN TIEMPOS DE
- Page 64 and 65: SITUACION DEL EMPLEO EN TIEMPOS DE
- Page 67 and 68: con una tasa de 32% para el conjunt
- Page 69 and 70: nivel relativamente bajo y se corre
- Page 71 and 72: Cuadro 36Tasa de desempleo equivale
- Page 73 and 74: Cuadro 37Tasa de subutilización gl
- Page 75 and 76: EL AVANCE DE LA PRECARIEDADLABORAL
- Page 77 and 78: ii) Una estructura ocupacional que
- Page 79 and 80: Estructura ocupacional Total La Paz
- Page 81 and 82: ajos niveles de salarios, la menor
- Page 83 and 84: trabajo precario extremo, y el 24%
- Page 85 and 86: Cuadro 42Calidad del empleo según
- Page 87 and 88: Cuadro 43Calidad del empleo según
- Page 89 and 90: El amplio espectro de empleos de ba
- Page 91 and 92: Precario 62,9 67,8 50,0 66,4 75,9 6
- Page 93 and 94: Precario 44,7 51,5 48,4 33,2 39,2 3
- Page 95 and 96: CONCLUSIONESLuego de una fase de re
- Page 97 and 98: Es importante considerar este indic
- Page 99 and 100: Este recuento del panorama laboral
- Page 101 and 102: ANEXO 1DISEÑO METODOLÓGICO DE LA
- Page 103 and 104: Cuadro 1Estructura del universo por
- Page 105 and 106: a que esta ciudad no cuenta con la
- Page 107 and 108: Ejemplo de zona con viviendas selec
- Page 109 and 110:
En la segunda visita, se recogió l
- Page 111 and 112:
ecuperar la información faltante y
- Page 113 and 114:
• Programación de rangos para to
- Page 115 and 116:
El Instituto Nacional de Estadísti
- Page 117 and 118:
Salario Mínimo Nacional (SM). Es l
- Page 119:
Este libro se terminó de imprimir