etude des facteurs potentiellement limitant de la repartition
etude des facteurs potentiellement limitant de la repartition
etude des facteurs potentiellement limitant de la repartition

You also want an ePaper? Increase the reach of your titles
YUMPU automatically turns print PDFs into web optimized ePapers that Google loves.
. . . . . . . . . . . . . . . . . . . . . . . . . . . . . . . . . . . . .<br />
. . . . . . . . . . . . . . . . . . . . . . . . . . . . . . . . . . . . .<br />
Zone 1<br />
.<br />
.<br />
.<br />
.<br />
.<br />
.<br />
.<br />
.<br />
.<br />
.<br />
.<br />
.<br />
. . . . . .<br />
. . . . . .<br />
.<br />
.<br />
.<br />
.<br />
.<br />
.<br />
.<br />
. . .<br />
Zone 3<br />
. . . .<br />
Zone 4<br />
. . . . . . . .<br />
. . . . . . . . . . .<br />
. . . . . . . . .<br />
. . . . . . . . . . . .<br />
. . . . . . . . . . . .<br />
. . . . . . . . . . . .<br />
. . . . . . . . . . . . . .<br />
Zone 2<br />
. . . . . . . .<br />
.<br />
.<br />
.<br />
.<br />
.<br />
.<br />
.<br />
.<br />
.<br />
.<br />
.<br />
.<br />
.<br />
.<br />
.<br />
.<br />
Zone 7<br />
. . . . . . . .<br />
. . . . . . . .<br />
. . . . . . . .<br />
. . . . . . . .<br />
. . . . . . . .<br />
.<br />
.<br />
.<br />
.<br />
.<br />
.<br />
.<br />
.<br />
.<br />
.<br />
.<br />
.<br />
.<br />
.<br />
.<br />
. Zone 6<br />
. . . . . . . .<br />
. . . . . . . .<br />
. . . . . . . .<br />
. . . . . . . .<br />
. . . . . . . .<br />
Zone 5<br />
. . . .<br />
. . . .<br />
. . . .<br />
. . . .<br />
. . . .<br />
. . . .<br />
. . . .<br />
. . . .<br />
. . . .<br />
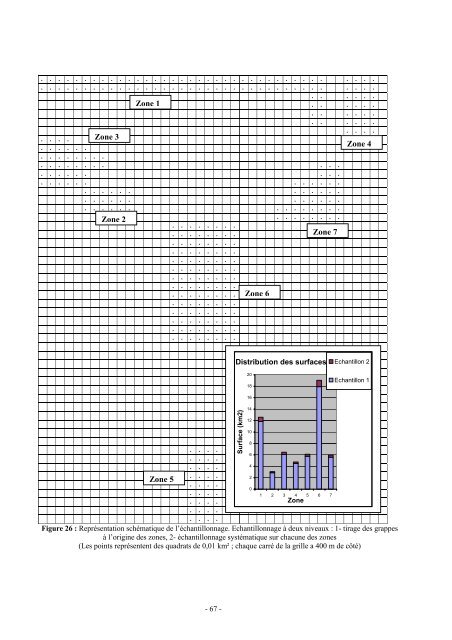
Figure 26 : Représentation schématique <strong>de</strong> l’échantillonnage. Echantillonnage à <strong>de</strong>ux niveaux : 1- tirage <strong><strong>de</strong>s</strong> grappes<br />
à l’origine <strong><strong>de</strong>s</strong> zones, 2- échantillonnage systématique sur chacune <strong><strong>de</strong>s</strong> zones<br />
(Les points représentent <strong><strong>de</strong>s</strong> quadrats <strong>de</strong> 0,01 km² ; chaque carré <strong>de</strong> <strong>la</strong> grille a 400 m <strong>de</strong> côté)<br />
- 67 -<br />
Distribution <strong><strong>de</strong>s</strong> surfaces<br />
Surface (km2)<br />
20<br />
18<br />
16<br />
14<br />
12<br />
10<br />
8<br />
6<br />
4<br />
2<br />
0<br />
1 2 3 4 5 6 7<br />
Zone<br />
Echantillon 2<br />
Echantillon 1