

estudo de competitividade da piscicultura no alto vale do itajaà - Cepa
estudo de competitividade da piscicultura no alto vale do itajaà - Cepa
estudo de competitividade da piscicultura no alto vale do itajaà - Cepa

Create successful ePaper yourself
Turn your PDF publications into a flip-book with our unique Google optimized e-Paper software.
Estu<strong>do</strong> <strong>de</strong> Competitivi<strong>da</strong><strong>de</strong> <strong>da</strong> Piscicultura <strong>no</strong> Alto Vale <strong>do</strong> Itajaí<br />
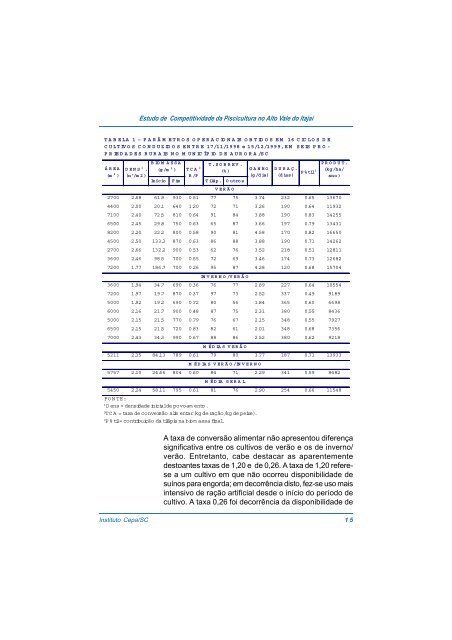
TAB ELA 1 – PARÂM ETROS OPERACIONAIS OBTIDOS EM 16 C ICLOS DE<br />
CULTIVOS CONDUZIDOS ENTRE 17/11/1998 e 15/12/1999,EM SEIS PRO-<br />
PRIED ADES RURAIS NO M UN ICÍPIO DE AURORA/SC<br />
ÁREA<br />
(m 2 )<br />
DENS 1 .<br />
(nº/m 2 )<br />
BIOM ASSA<br />
T. SOBREV.<br />
(g /m 2 ) TCA 2<br />
(% )<br />
GANHO DURAÇ.<br />
P%til 3<br />
R/P<br />
(g /d ia) (d ias)<br />
Iníc io F im T iláp. O utros<br />
VERÃO<br />
2700 2.68 61.9 930 0.51 77 75 3.74 232 0.65 13670<br />
4400 2.00 20.1 640 1.20 72 71 3.26 190 0.64 11932<br />
7100 2.40 72.5 810 0.64 91 84 3.88 190 0.83 14255<br />
6500 2.45 29.8 750 0.63 65 87 3.66 197 0.79 13431<br />
8200 2.20 22.2 800 0.58 90 81 4.58 170 0.82 16650<br />
4500 2.50 133.3 870 0.63 86 88 3.88 190 0.71 14262<br />
2700 2.66 132.2 900 0.53 62 76 3.52 218 0.51 12811<br />
3600 2.46 98.5 700 0.55 72 69 3.46 174 0.73 12682<br />
7200 1.77 186.7 700 0.26 95 87 4.28 120 0.68 15704<br />
INVERNO/VERÃO<br />
3600 1.94 34.7 690 0.36 76 77 2.89 227 0.64 10554<br />
7200 1.97 19.7 870 0.37 97 73 2.52 337 0.49 9189<br />
5000 1.92 19.2 690 0.72 80 56 1.84 365 0.60 6698<br />
6000 2.16 21.7 900 0.48 87 75 2.31 380 0.55 8436<br />
5000 2.15 21.5 770 0.79 76 67 2.15 348 0.55 7927<br />
6500 2.15 21.5 720 0.83 82 61 2.01 348 0.68 7356<br />
7000 2.43 34.3 990 0.67 88 86 2.52 380 0.62 9218<br />
M ÉDIAS VERÃO<br />
5211 2.35 84.13 789 0.61 79 80 3.77 187 0.71 13933<br />
M ÉDIAS VERÃO/INVERNO<br />
5757 2.10 24.66 804 0.60 84 71 2.29 341 0.59 8482<br />
M ÉDIA GERAL<br />
5450 2.24 58.11 795 0.61 81 76 2.90 254 0.66 11548<br />
FONTE:<br />
1<br />
Dens = <strong>de</strong>nsi<strong>da</strong><strong>de</strong> inicial<strong>de</strong> povoam ento.<br />
2<br />
TCA = taxa <strong>de</strong> conversão alim entar(kg <strong>de</strong> ração/kg <strong>de</strong> peixe).<br />
3<br />
P%til= contribuição <strong>da</strong> tilápia na biom assa final.<br />
PRODUT.<br />
(kg /ha/<br />
a<strong>no</strong> )<br />
A taxa <strong>de</strong> conversão alimentar não apresentou diferença<br />
significativa entre os cultivos <strong>de</strong> verão e os <strong>de</strong> inver<strong>no</strong>/<br />
verão. Entretanto, cabe <strong>de</strong>stacar as aparentemente<br />
<strong>de</strong>stoantes taxas <strong>de</strong> 1,20 e <strong>de</strong> 0,26. A taxa <strong>de</strong> 1,20 referese<br />
a um cultivo em que não ocorreu disponibili<strong>da</strong><strong>de</strong> <strong>de</strong><br />
suí<strong>no</strong>s para engor<strong>da</strong>; em <strong>de</strong>corrência disto, fez-se uso mais<br />
intensivo <strong>de</strong> ração artificial <strong>de</strong>s<strong>de</strong> o início <strong>do</strong> perío<strong>do</strong> <strong>de</strong><br />
cultivo. A taxa 0,26 foi <strong>de</strong>corrência <strong>da</strong> disponibili<strong>da</strong><strong>de</strong> <strong>de</strong><br />
Instituto <strong>Cepa</strong>/SC 15


