

estudo de competitividade da piscicultura no alto vale do itajaà - Cepa
estudo de competitividade da piscicultura no alto vale do itajaà - Cepa
estudo de competitividade da piscicultura no alto vale do itajaà - Cepa

Create successful ePaper yourself
Turn your PDF publications into a flip-book with our unique Google optimized e-Paper software.
Estu<strong>do</strong> <strong>de</strong> Competitivi<strong>da</strong><strong>de</strong> <strong>da</strong> Piscicultura <strong>no</strong> Alto Vale <strong>do</strong> Itajaí<br />
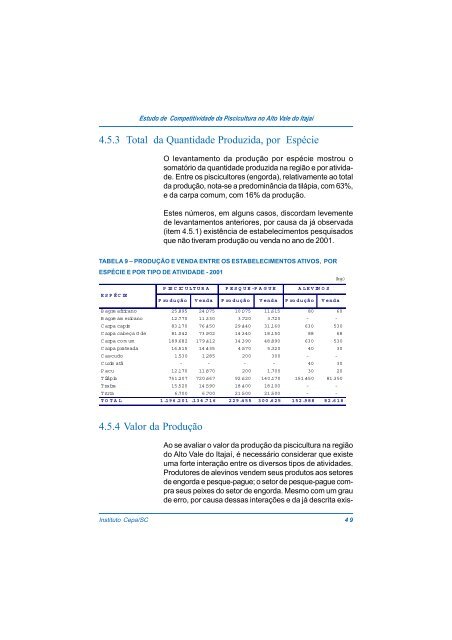
4.5.3 Total <strong>da</strong> Quanti<strong>da</strong><strong>de</strong> Produzi<strong>da</strong>, por Espécie<br />
O levantamento <strong>da</strong> produção por espécie mostrou o<br />
somatório <strong>da</strong> quanti<strong>da</strong><strong>de</strong> produzi<strong>da</strong> na região e por ativi<strong>da</strong><strong>de</strong>.<br />
Entre os piscicultores (engor<strong>da</strong>), relativamente ao total<br />
<strong>da</strong> produção, <strong>no</strong>ta-se a pre<strong>do</strong>minância <strong>da</strong> tilápia, com 63%,<br />
e <strong>da</strong> carpa comum, com 16% <strong>da</strong> produção.<br />
Estes números, em alguns casos, discor<strong>da</strong>m levemente<br />
<strong>de</strong> levantamentos anteriores, por causa <strong>da</strong> já observa<strong>da</strong><br />
(item 4.5.1) existência <strong>de</strong> estabelecimentos pesquisa<strong>do</strong>s<br />
que não tiveram produção ou ven<strong>da</strong> <strong>no</strong> a<strong>no</strong> <strong>de</strong> 2001.<br />
TABELA 9 – PRODUÇÃO E VENDA ENTRE OS ESTABELECIMENTOS ATIVOS, POR<br />
ESPÉCIE E POR TIPO DE ATIVIDADE - 2001<br />
(kg )<br />
PISCICULTURA PESQUE-PAGUE ALEVINOS<br />
ESPÉCIE<br />
P rodução Ven<strong>da</strong> P rodução Ven<strong>da</strong> P rodução Ven<strong>da</strong><br />
Bagre africa<strong>no</strong> 25.895 24.075 10.075 11.615 80 60<br />
Bagre am erica<strong>no</strong> 12.770 11.330 3.720 3.720 - -<br />
Carpa capim 83.170 76.450 29.440 31.160 630 530<br />
Carpa cabeça G<strong>de</strong> 81.042 73.902 14.340 18.150 88 68<br />
Carpa co m um 189.682 179.412 34.390 48.890 630 530<br />
Carpa pratea<strong>da</strong> 16.515 14.435 4.570 5.320 40 30<br />
C ascu<strong>do</strong> 1.530 1.285 200 300 - -<br />
Curimatã - - - - 40 30<br />
Pacu 12.170 11.870 200 1.700 30 20<br />
Tilápia 751.207 720.667 92.620 140.170 151.450 81.350<br />
T raíra 15 .520 14.590 18.400 18.100 - -<br />
Truta 6.700 6.700 21.500 21.500 - -<br />
TOTAL 1.196.201 .134.716 229.455 300.625 152.988 82.618<br />
4.5.4 Valor <strong>da</strong> Produção<br />
Ao se avaliar o valor <strong>da</strong> produção <strong>da</strong> <strong>piscicultura</strong> na região<br />
<strong>do</strong> Alto Vale <strong>do</strong> Itajaí, é necessário consi<strong>de</strong>rar que existe<br />
uma forte interação entre os diversos tipos <strong>de</strong> ativi<strong>da</strong><strong>de</strong>s.<br />
Produtores <strong>de</strong> alevi<strong>no</strong>s ven<strong>de</strong>m seus produtos aos setores<br />
<strong>de</strong> engor<strong>da</strong> e pesque-pague; o setor <strong>de</strong> pesque-pague compra<br />
seus peixes <strong>do</strong> setor <strong>de</strong> engor<strong>da</strong>. Mesmo com um grau<br />
<strong>de</strong> erro, por causa <strong>de</strong>ssas interações e <strong>da</strong> já <strong>de</strong>scrita exis-<br />
Instituto <strong>Cepa</strong>/SC 49


