- Page 2 and 3:
Serviceeftersynet af vilka rene for
- Page 4 and 5:
3.1.4 Åben dør-området .........
- Page 6 and 7:
1 Indledning og sammenfatning 1.1 I
- Page 8 and 9:
Kontorchef Søren Gaard, Erhvervs-
- Page 10 and 11:
som selskaberne har indrettet sig e
- Page 12 and 13:
der skal deles mellem stat og retti
- Page 14 and 15:
Investeringsprojekterne i Nordsøen
- Page 16 and 17:
1.2.3 Nordsøproduktionen og staten
- Page 18 and 19:
2 pct. og 6 pct. Samme udvikling i
- Page 20 and 21:
Figur 1.5. Statens andel af det ska
- Page 22 and 23:
Danmark er endvidere, set i forhold
- Page 24 and 25:
felter eller i marginen af eksister
- Page 26 and 27:
Forskellen mellem statens andel fø
- Page 28 and 29:
form af, at indkomsten vil blive s
- Page 30 and 31:
Inddragelse under kulbrintebeskatni
- Page 32 and 33:
2 Udvikling i vilkårene for kulbri
- Page 34 and 35:
Statsdeltagelse. Fra 1. januar 2004
- Page 36 and 37:
Med indførelsen af det nye regels
- Page 38 and 39:
2.3 Ændringer i kulbrinteskattelov
- Page 40 and 41:
Fremadrettet forventes der endnu en
- Page 42 and 43:
Tabel 2.1. Provenu fra olie- og gas
- Page 44 and 45:
Figur 2.5. Statens andel af det ska
- Page 46 and 47:
3 Beskrivelse af gældende rammevil
- Page 48 and 49:
Tilladelser til efterforskning og i
- Page 50 and 51:
dergrunden i det ansøgte område.
- Page 52 and 53:
edre seismiske undersøgelsesmetode
- Page 54 and 55:
Figur 3.4. Udviklingen i antal till
- Page 56 and 57:
3.1.7 Vilkår for kommende udbudsru
- Page 58 and 59:
De enkelte elementer beskrives i de
- Page 60 and 61:
3.2.1.4 Afskrivning Udgifter til an
- Page 62 and 63:
Hvis udledningsvirksomheder ikke fo
- Page 64 and 65:
Nedsættelsen gælder både i relat
- Page 66 and 67:
3.2.1.9.2 Nye regler Satsen, som se
- Page 68 and 69:
Erfaringerne fra udviklingen i den
- Page 70 and 71:
3.3.3 Behov for teknologiforbedring
- Page 72 and 73:
I Norge og Storbritannien er der fo
- Page 74 and 75:
4.3.2 Norge Der betales 28 pct. i s
- Page 76 and 77:
Wood Mackenzie har foretaget en sam
- Page 78 and 79:
For bedre at kunne sammenligne hvor
- Page 80 and 81:
Selskabernes betaling til staten i
- Page 82 and 83:
Figur 5.1. Afkastgrad før skat ved
- Page 84 and 85:
Det højere afkast i Danmark kan fo
- Page 86 and 87:
ske muligheder, der er til rådighe
- Page 88 and 89:
udsætninger er feltet imidlertid r
- Page 90 and 91:
I beregningerne i denne rapport fas
- Page 92 and 93:
Figur 5.3. Privatøkonomisk optimal
- Page 94 and 95:
Figur 5.5. Optimalt investeringsomf
- Page 96 and 97:
Effekten af en rentestigning er min
- Page 98 and 99:
5.2.5 Reduktion af forvridningstabe
- Page 100 and 101:
5.3.1 Statsdeltagelse som alternati
- Page 102 and 103:
Samfundsøkonomisk kan det derfor g
- Page 104 and 105:
Figur 5.6. Omkostningssammenligning
- Page 106 and 107:
6 Optioner for ændring af rammevil
- Page 108 and 109:
Ved valg af overgangsregler er det
- Page 110 and 111:
For ikke både at give selskaberne
- Page 112 and 113:
6.1.1.4 Provenumæssige konsekvense
- Page 114 and 115:
udnytte fremførte underskud, hvorv
- Page 116 and 117:
Kompensationen kan således - uanse
- Page 118 and 119:
Boks 6.1. Beregning af kontantværd
- Page 120 and 121:
Tabel 6.4. Afvigelse fra de sande o
- Page 122 and 123:
Fik selskabet derimod udbetalt skat
- Page 124 and 125:
Det har med det eksisterende omkost
- Page 126 and 127:
indvinding af kulbrinter - som udga
- Page 128 and 129:
6.3.4 Indkomst fra behandling og tr
- Page 130 and 131:
Merprovenuet opstår i det omfang,
- Page 132 and 133:
Udvalget vedrørende Eftersyn af Vi
- Page 134 and 135:
Beskatning af ressourcerne i Nords
- Page 136 and 137:
Ressourcerente og beskatning princi
- Page 138 and 139:
• Impl.: Selskabsskat på hele SI
- Page 140 and 141:
• Formue (RR): Ca. 50 % af BNP
- Page 142 and 143:
• Er nuværende system “tæt p
- Page 144 and 145:
Effektiv skat af ressourcerenten Pc
- Page 146 and 147:
• Norsk vs. dansk beskatning. Nor
- Page 148 and 149:
Konklusioner (2) • Beskatningsgru
- Page 150 and 151:
Noen hovedpunkter med relevans for
- Page 152 and 153:
Lisenstildeling og konkurranse, for
- Page 154 and 155:
Statsdeltakelse og skatt • Rimeli
- Page 156 and 157:
Tilnærmet nøytralt skattesystem;
- Page 158 and 159:
Figuren viser en liten vekst i anta
- Page 160 and 161:
Oljeprisen har økt 2003-2008, noe
- Page 162 and 163:
Gjenværende utfordringer • Norsk
- Page 164 and 165:
noen kompensasjon hvis det skjer ne
- Page 166 and 167:
Hvis skattesystemet er nøytralt me
- Page 168 and 169:
7. Skatt: Fortsatt problemer og van
- Page 170 and 171:
Referanser Aarsnes, Frian, og Pette
- Page 172 and 173:
DANISH OPERATORS Grundvilkår for o
- Page 174 and 175:
DANISH OPERATORS Produktionen er fo
- Page 176 and 177:
DANISH OPERATORS Om rammevilkår...
- Page 178 and 179:
Disposition… Værdikæden Beskæf
- Page 180 and 181:
En fuldtidsansat i et olie og gasse
- Page 184 and 185:
Danish Offshore Industry
- Page 186 and 187:
Aftaleretlige muligheder for at for
- Page 188 and 189:
Opdraget • Som i overskriften •
- Page 190 and 191:
Modifikationer • ”lov og ærbar
- Page 192 and 193:
Aftalens indhold i øvrigt • Til
- Page 194 and 195:
Forudsætningslæren Hvis en foruds
- Page 196 and 197:
Forudsætningssvigt? • Indebærer
- Page 198 and 199:
Bestemmelsens baggrund • Forbruge
- Page 200 and 201:
Eksempel: Ula-sagen Nordiske Domme
- Page 202 and 203:
Om hardship og genforhandling Kende
- Page 204 and 205:
Konklusion • Svært at få øje p
- Page 206 and 207:
egeringen ikke ville have indgået
- Page 208 and 209:
Konsekvensen af at antage, at betal
- Page 210 and 211:
I forudsætningslærens tre betinge
- Page 212 and 213:
. Principielle betænkeligheder Sku
- Page 214 and 215:
enhed. Feltet viste sig at producer
- Page 216 and 217:
vinding - beskæftiger sig med muli
- Page 218 and 219:
næppe i overensstemmelse med gæld
- Page 249: Kammeradvokaten 28. FEBR AR 2013 En
- Page 260 and 261: Udvalget for Serviceeftersyn af vil
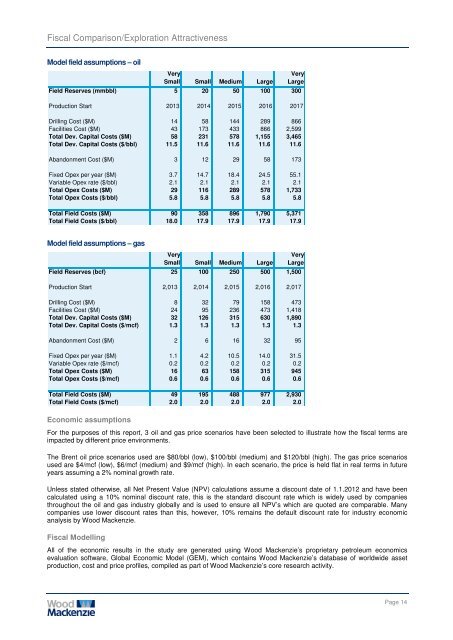
- Page 262 and 263: Fiscal Comparison/Exploration Attra
- Page 264 and 265: Fiscal Comparison/Exploration Attra
- Page 266 and 267: Fiscal Comparison/Exploration Attra
- Page 268 and 269: Fiscal Comparison/Exploration Attra
- Page 270 and 271: Fiscal Comparison/Exploration Attra
- Page 274 and 275: Fiscal Comparison/Exploration Attra
- Page 276 and 277: Fiscal Comparison/Exploration Attra
- Page 278 and 279: Fiscal Comparison/Exploration Attra
- Page 280 and 281: Fiscal Comparison/Exploration Attra
- Page 282 and 283: Fiscal Comparison/Exploration Attra
- Page 284 and 285: Fiscal Comparison/Exploration Attra
- Page 286 and 287: Fiscal Comparison/Exploration Attra
- Page 288 and 289: Fiscal Comparison/Exploration Attra
- Page 290 and 291: Fiscal Comparison/Exploration Attra
- Page 292 and 293: Fiscal Comparison/Exploration Attra
- Page 294 and 295: Fiscal Comparison/Exploration Attra
- Page 296 and 297: Fiscal Comparison/Exploration Attra
- Page 298 and 299: Fiscal Comparison/Exploration Attra
- Page 300 and 301: Fiscal Comparison/Exploration Attra
- Page 302 and 303: Fiscal Comparison/Exploration Attra
- Page 304 and 305: Fiscal Comparison/Exploration Attra
- Page 306 and 307: Fiscal Comparison/Exploration Attra
- Page 308 and 309: Fiscal Comparison/Exploration Attra
- Page 310 and 311: Fiscal Comparison/Exploration Attra
- Page 312 and 313: Fiscal Comparison/Exploration Attra
- Page 314 and 315: Fiscal Comparison/Exploration Attra
- Page 316 and 317: Fiscal Comparison/Exploration Attra
- Page 318 and 319: Fiscal Comparison/Exploration Attra
- Page 320 and 321: Fiscal Comparison/Exploration Attra
- Page 322 and 323:
Fiscal Comparison/Exploration Attra
- Page 324 and 325:
Fiscal Comparison/Exploration Attra
- Page 326 and 327:
Fiscal Comparison/Exploration Attra
- Page 328 and 329:
Fiscal Comparison/Exploration Attra
- Page 330 and 331:
Fiscal Comparison/Exploration Attra
- Page 332 and 333:
Fiscal Comparison/Exploration Attra
- Page 334 and 335:
Ressourceopgørelsen anvendes som g
- Page 336 and 337:
vanskeligt at forudse, hvilke nye t
- Page 338 and 339:
1.2 Ressourcer opdelt på de 3 omr
- Page 340 and 341:
For perioden 2004-2011 udgør gaspr
- Page 342 and 343:
Figur 1.9. Faktisk olieproduktion 2
- Page 344 and 345:
Figur 1.11. Faktisk gasproduktion 2
- Page 346 and 347:
Bilag 5: Oversigt over de ved udgan
- Page 348 and 349:
Tilladelse 4/98 Selskab Andel (%) O
- Page 350 and 351:
Tilladelse 12/06 Selskab Andel (%)