NOEP Table 6-5: Benefit of Beach Restorations in <strong>California</strong> 40 Location Conceptual Project Cost Net Benefit Benefit/Cost Ratio Venice Beach Groin repair $2,000,000 $130,270,670 65.14 Leo Carrillo <strong>State</strong> Retention $170,000 $8,310,900 48.89 Beach structure/dune Dockweiler Beach Groin repair $1,350,000 $42,520,220 31.50 Topanga Beach Seawall $630,000 $8,798,226 13.97 East Beach Groin repair $1,500,000 $17,379,719 11.59 Will Rogers Beach Groin repair $3,900,000 $43,060,455 11.04 Pierpont Beach Groin repair $820,000 $13,432,299 16.38 Hueneme Beach Seawall $850,000 $12,382,432 14.57 El Granda Revetment $1,000,000 $13,843,292 13.84 Beach Boulevard Repair Rock toe $824,000 $10,328,642 12.53 Carpinteria <strong>State</strong> Beach Cobble berm $6,500,000 $44,106,263 6.79 Pismo Beach Nourishment/retention $4,000,000 $26,059,465 6.51 structure San Buenaventura Groin repair $3,800,000 $14,945,698 3.93 Beach Access way Revetment $50,000 $187,382 3.75 El Capitan <strong>State</strong> Nourishment/retention $3,600,000 $10,301,836 2.86 Beach Ashby Interchange Revetment $275,000 $735,491 2.67 The Hook Shore retention wall $2,000,000 $4,896,221 2.45 Regugio <strong>State</strong> Nourishment/retention $2,600,000 $5,518,840 2.12 Beach Coyote Point Nourishment/retention $5,500,000 $8,579,945 1.56 Twin Lakes Beach Seawall $5,000,000 $7,632,443 1.53 Surfers Point Cobble berm/retention $7,700,000 $10,820,353 1.41 Carlsbad <strong>State</strong> Nourishment $21,000,000 $28,516,254 1.36 Beach Hobson Nourishment/retention $12,300,000 $12,752,134 1.04 La Conchita Nourishment/retention $12,300,000 $12,608,042 1.03 Dan Blocker Beach Nourishment/retention $5,700,000 $5,748,354 1.01 Leadbetter Beach Seawall $2,360,000 $1,474,537 0.62 Isla Vista Nourishment/retention $13,700,000 $6,781,239 0.49 Cayucos Beach Seawall $820,000 $372,877 0.45 Source: <strong>California</strong> Beach Restoration Study, Department of Boating and Waterway 6.3.1 Funding Sources In 1999, the Public Beach Restoration Program (PBRP) was created under the administration of the Department of Boating and Waterway. The program was motivated by the loss of public beaches due to man’s activities in upland watersheds and along the shoreline. The following table lists the projects and funding for the program, which was funded for $10 million in grants for fiscal year 2000-2001. 40 Definitions to help understand chart: groins and jetties are walls built perpendicular to the shoreline. They are designed to trap sand that is moving along the shore due to the long shore current. A groin usually extends to the end of the surf zone while a jetty extends further into an inlet to stabilize a navigation channel. The construction of both groins and jetties severely affects the flow of sand moved by the long shore currents. 94
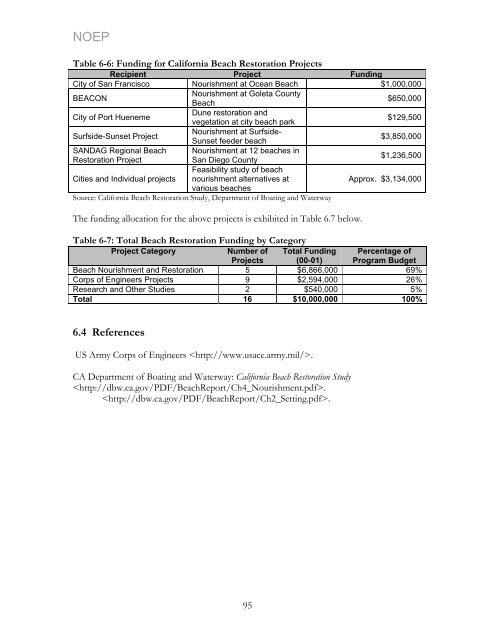
NOEP Table 6-6: Funding for <strong>California</strong> Beach Restoration Projects Recipient Project Funding City of San Francisco Nourishment at <strong>Ocean</strong> Beach $1,000,000 BEACON Nourishment at Goleta County Beach $650,000 City of Port Hueneme Dune restoration and vegetation at city beach park $129,500 Surfside-Sunset Project Nourishment at Surfside- Sunset feeder beach $3,850,000 SANDAG Regional Beach Restoration Project Nourishment at 12 beaches in San Diego County Feasibility study of beach $1,236,500 Cities and Individual projects nourishment alternatives at various beaches Approx. $3,134,000 Source: <strong>California</strong> Beach Restoration Study, Department of Boating and Waterway The funding allocation for the above projects is exhibited in Table 6.7 below. Table 6-7: Total Beach Restoration Funding by Category Project Category Number of Total Funding Percentage of Projects (00-01) Program Budget Beach Nourishment and Restoration 5 $6,866,000 69% Corps of Engineers Projects 9 $2,594,000 26% Research and Other Studies 2 $540,000 5% Total 16 $10,000,000 100% 6.4 References US Army Corps of Engineers . CA Department of Boating and Waterway: <strong>California</strong> Beach Restoration Study . . 95
- Page 1 and 2:
NOEP CALIFORNIA’S OCEAN ECONOMY R
- Page 3 and 4:
NOEP Table of Contents Executive Su
- Page 5 and 6:
NOEP PART IV APPENDIX .............
- Page 7 and 8:
NOEP Table 6-4: 2000 Employment, Wa
- Page 9 and 10:
NOEP Figure 8-4: Fishing and Boatin
- Page 11 and 12:
NOEP Executive Summary California
- Page 13 and 14:
NOEP Acknowledgements The State of
- Page 15 and 16:
NOEP PART I BACKGROUND AND SUMMARY
- Page 17 and 18:
NOEP ocean and economic activity, s
- Page 19 and 20:
NOEP The use of SIC codes and geogr
- Page 21 and 22:
NOEP Chapter 2 Summary of Findings
- Page 23 and 24:
NOEP Table 2-2: Regional Population
- Page 25 and 26:
NOEP Table 2-5: Growth Rates for Co
- Page 27 and 28:
NOEP 2.4 California’s Ocean Econo
- Page 29 and 30:
NOEP 2.5 California’s Ocean Econo
- Page 31 and 32:
NOEP Table 2-10: California Ocean E
- Page 33 and 34:
NOEP Figure 2-5 shows that the prop
- Page 35 and 36:
NOEP Number of Workers 1,000,000 10
- Page 37 and 38:
NOEP 2.7 Indirect and Induced Estim
- Page 39 and 40:
NOEP • Construction trends in mar
- Page 41 and 42:
NOEP PART II THE SECTORS OF THE CAL
- Page 43 and 44:
NOEP assess: a) Landings and landed
- Page 45 and 46:
NOEP Billion Pounds 12 10 8 6 4 2 0
- Page 47 and 48:
NOEP Percentage 25% 20% 15% 10% 5%
- Page 49 and 50:
NOEP in terms of revenue, replacing
- Page 51 and 52:
NOEP Figure 3-6 shows the landings
- Page 53 and 54: NOEP Thousands of Wet Tons 200 180
- Page 55 and 56: NOEP 3.4 Conclusion Living Resource
- Page 57 and 58: NOEP Chapter 4 California Ocean Min
- Page 59 and 60: NOEP Table 4-3: California Offshore
- Page 61 and 62: NOEP Table 4-6: Coastal Counties On
- Page 63 and 64: NOEP are concentrated in less than
- Page 65 and 66: NOEP Chapter 5 California Marine Tr
- Page 67 and 68: NOEP million tons of foreign cargo
- Page 69 and 70: NOEP 120,000,000 100,000,000 80,000
- Page 71 and 72: NOEP From 1992 to 2001, total value
- Page 73 and 74: NOEP Table 5-4: Port Rankings 2001
- Page 75 and 76: NOEP 5.2 CA Water Transportation: R
- Page 77 and 78: NOEP Table 5-9: Warehousing (SIC co
- Page 79 and 80: NOEP Table 5-11: Marine Passenger T
- Page 81 and 82: NOEP Table 5-13: Search and Navigat
- Page 83 and 84: NOEP 5.2 References California Mari
- Page 85 and 86: NOEP Chapter 6 California Marine Co
- Page 87 and 88: NOEP 6.2.1 Historical Capital Expen
- Page 89 and 90: NOEP 60.0% 50.0% 40.0% 30.0% 20.0%
- Page 91 and 92: NOEP CA Share of Total U.S. Port Ca
- Page 93 and 94: NOEP 40 35 30 25 20 15 10 5 0 US Po
- Page 95 and 96: NOEP 6.2.2 Proposed Capital Expendi
- Page 97 and 98: NOEP 2,500 2,000 1,500 1,000 500 0
- Page 99 and 100: NOEP CA Share of Capital Expenditur
- Page 101 and 102: NOEP 6.2.4 Economic Impact The foll
- Page 103: NOEP 6.3 Beach Nourishment 39 In Ca
- Page 107 and 108: NOEP Chapter 7: California Ship & B
- Page 109 and 110: NOEP research ships for commercial
- Page 111 and 112: NOEP 7.3 References CA Employment D
- Page 113 and 114: NOEP Chapter 8 Coastal Tourism & Re
- Page 115 and 116: NOEP volume and diversity, along th
- Page 117 and 118: NOEP participated in marine recreat
- Page 119 and 120: NOEP 8.2.2 California Beach Valuati
- Page 121 and 122: NOEP No attempt has been made to es
- Page 123 and 124: NOEP 8.2.3 Recreational Fishing and
- Page 125 and 126: NOEP 14,000,000 12,000,000 10,000,0
- Page 127 and 128: NOEP The travel industry supported
- Page 129 and 130: NOEP 8.4 Regional Estimates of Cali
- Page 131 and 132: NOEP Table 8-16 Cont. SIC4 Region N
- Page 133 and 134: NOEP Table 8-17 summarizes the tota
- Page 135 and 136: NOEP 8.5 References California Fast
- Page 137 and 138: NOEP PART III CONCLUSION Future Dir
- Page 139 and 140: NOEP PART IV APPENDIX Appendix A: T
- Page 141 and 142: NOEP All ES-202 data are reported t
- Page 143 and 144: NOEP At the same time, this data se
- Page 145 and 146: NOEP fishing, or boating will not o
- Page 147 and 148: NOEP Table B-1: Commercial Fisherie
- Page 149 and 150: NOEP Appendix C: California Marine
- Page 151 and 152: NOEP Appendix D: California Beaches
- Page 153 and 154: NOEP Table D-1: Regional Beaches an
- Page 155 and 156:
NOEP Table D-1: Regional Beaches an
- Page 157 and 158:
NOEP Table D-2: Regional Beaches fr
- Page 159 and 160:
NOEP Table D-2: Regional Beaches fr
- Page 161 and 162:
NOEP Region County Beach Gray Whale
- Page 163 and 164:
NOEP Region County Beach San Luis O
- Page 165 and 166:
NOEP Region County Beach La Piedra