

California's Ocean Economy - California Resources Agency - State ...
California's Ocean Economy - California Resources Agency - State ...
California's Ocean Economy - California Resources Agency - State ...

Create successful ePaper yourself
Turn your PDF publications into a flip-book with our unique Google optimized e-Paper software.
NOEP<br />
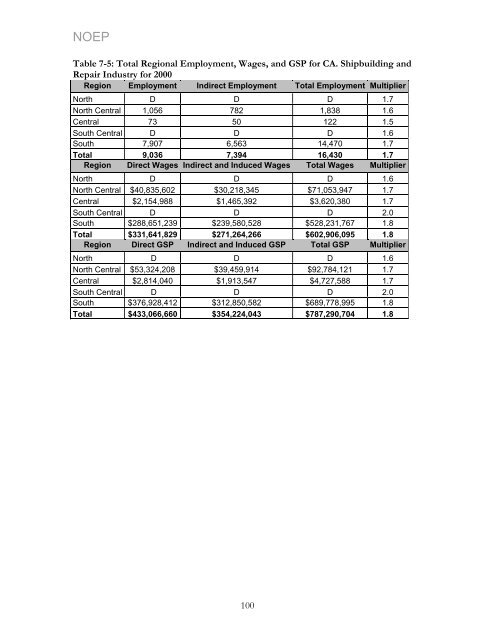
Table 7-5: Total Regional Employment, Wages, and GSP for CA. Shipbuilding and<br />
Repair Industry for 2000<br />
Region Employment Indirect Employment Total Employment Multiplier<br />
North D D D 1.7<br />
North Central 1,056 782 1,838 1.6<br />
Central 73 50 122 1.5<br />
South Central D D D 1.6<br />
South 7,907 6,563 14,470 1.7<br />
Total 9,036 7,394 16,430 1.7<br />
Region Direct Wages Indirect and Induced Wages Total Wages Multiplier<br />
North D D D 1.6<br />
North Central $40,835,602 $30,218,345 $71,053,947 1.7<br />
Central $2,154,988 $1,465,392 $3,620,380 1.7<br />
South Central D D D 2.0<br />
South $288,651,239 $239,580,528 $528,231,767 1.8<br />
Total $331,641,829 $271,264,266 $602,906,095 1.8<br />
Region Direct GSP Indirect and Induced GSP Total GSP Multiplier<br />
North D D D 1.6<br />
North Central $53,324,208 $39,459,914 $92,784,121 1.7<br />
Central $2,814,040 $1,913,547 $4,727,588 1.7<br />
South Central D D D 2.0<br />
South $376,928,412 $312,850,582 $689,778,995 1.8<br />
Total $433,066,660 $354,224,043 $787,290,704 1.8<br />
100


