

California's Ocean Economy - California Resources Agency - State ...
California's Ocean Economy - California Resources Agency - State ...
California's Ocean Economy - California Resources Agency - State ...

You also want an ePaper? Increase the reach of your titles
YUMPU automatically turns print PDFs into web optimized ePapers that Google loves.
NOEP<br />
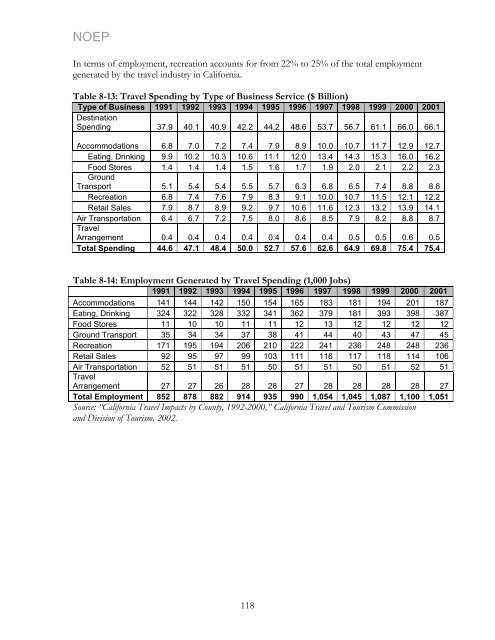
In terms of employment, recreation accounts for from 22% to 25% of the total employment<br />
generated by the travel industry in <strong>California</strong>.<br />
Table 8-13: Travel Spending by Type of Business Service ($ Billion)<br />
Type of Business 1991 1992 1993 1994 1995 1996 1997 1998 1999 2000 2001<br />
Destination<br />
Spending 37.9 40.1 40.9 42.2 44.2 48.6 53.7 56.7 61.1 66.0 66.1<br />
Accommodations 6.8 7.0 7.2 7.4 7.9 8.9 10.0 10.7 11.7 12.9 12.7<br />
Eating, Drinking 9.9 10.2 10.3 10.6 11.1 12.0 13.4 14.3 15.3 16.0 16.2<br />
Food Stores<br />
Ground<br />
1.4 1.4 1.4 1.5 1.6 1.7 1.9 2.0 2.1 2.2 2.3<br />
Transport 5.1 5.4 5.4 5.5 5.7 6.3 6.8 6.5 7.4 8.8 8.6<br />
Recreation 6.8 7.4 7.6 7.9 8.3 9.1 10.0 10.7 11.5 12.1 12.2<br />
Retail Sales 7.9 8.7 8.9 9.2 9.7 10.6 11.6 12.3 13.2 13.9 14.1<br />
Air Transportation<br />
Travel<br />
6.4 6.7 7.2 7.5 8.0 8.6 8.5 7.9 8.2 8.8 8.7<br />
Arrangement 0.4 0.4 0.4 0.4 0.4 0.4 0.4 0.5 0.5 0.6 0.5<br />
Total Spending 44.6 47.1 48.4 50.0 52.7 57.6 62.6 64.9 69.8 75.4 75.4<br />
Table 8-14: Employment Generated by Travel Spending (1,000 Jobs)<br />
1991 1992 1993 1994 1995 1996 1997 1998 1999 2000 2001<br />
Accommodations 141 144 142 150 154 165 183 181 194 201 187<br />
Eating, Drinking 324 322 328 332 341 362 379 181 393 398 387<br />
Food Stores 11 10 10 11 11 12 13 12 12 12 12<br />
Ground Transport 35 34 34 37 38 41 44 40 43 47 45<br />
Recreation 171 195 194 206 210 222 241 236 248 248 236<br />
Retail Sales 92 95 97 99 103 111 116 117 118 114 106<br />
Air Transportation<br />
Travel<br />
52 51 51 51 50 51 51 50 51 52 51<br />
Arrangement 27 27 26 28 28 27 28 28 28 28 27<br />
Total Employment 852 878 882 914 935 990 1,054 1,045 1,087 1,100 1,051<br />
Source: “<strong>California</strong> Travel Impacts by County, 1992-2000,” <strong>California</strong> Travel and Tourism Commission<br />
and Division of Tourism, 2002.<br />
118


