

California's Ocean Economy - California Resources Agency - State ...
California's Ocean Economy - California Resources Agency - State ...
California's Ocean Economy - California Resources Agency - State ...

Create successful ePaper yourself
Turn your PDF publications into a flip-book with our unique Google optimized e-Paper software.
NOEP<br />
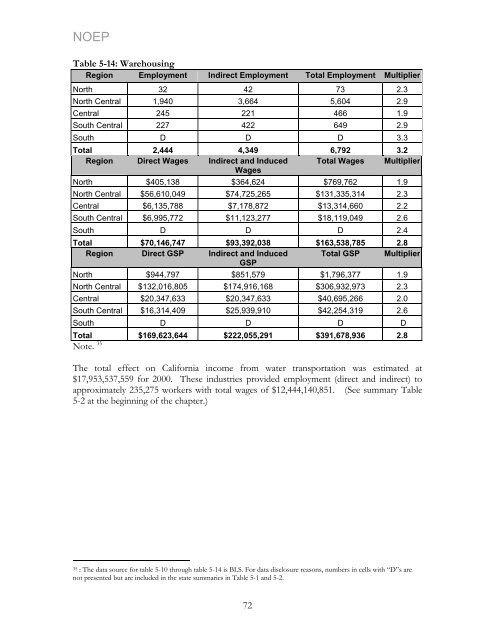
Table 5-14: Warehousing<br />
Region Employment Indirect Employment Total Employment Multiplier<br />
North 32 42 73 2.3<br />
North Central 1,940 3,664 5,604 2.9<br />
Central 245 221 466 1.9<br />
South Central 227 422 649 2.9<br />
South D D D 3.3<br />
Total 2,444 4,349 6,792 3.2<br />
Region Direct Wages Indirect and Induced<br />
Wages<br />
Total Wages Multiplier<br />
North $405,138 $364,624 $769,762 1.9<br />
North Central $56,610,049 $74,725,265 $131,335,314 2.3<br />
Central $6,135,788 $7,178,872 $13,314,660 2.2<br />
South Central $6,995,772 $11,123,277 $18,119,049 2.6<br />
South D D D 2.4<br />
Total $70,146,747 $93,392,038 $163,538,785 2.8<br />
Region Direct GSP Indirect and Induced<br />
GSP<br />
Total GSP Multiplier<br />
North $944,797 $851,579 $1,796,377 1.9<br />
North Central $132,016,805 $174,916,168 $306,932,973 2.3<br />
Central $20,347,633 $20,347,633 $40,695,266 2.0<br />
South Central $16,314,409 $25,939,910 $42,254,319 2.6<br />
South D D D D<br />
Total $169,623,644 $222,055,291 $391,678,936 2.8<br />
Note. 35<br />
The total effect on <strong>California</strong> income from water transportation was estimated at<br />
$17,953,537,559 for 2000. These industries provided employment (direct and indirect) to<br />
approximately 235,275 workers with total wages of $12,444,140,851. (See summary Table<br />
5-2 at the beginning of the chapter.)<br />
35 : The data source for table 5-10 through table 5-14 is BLS. For data disclosure reasons, numbers in cells with “D”s are<br />
not presented but are included in the state summaries in Table 5-1 and 5-2.<br />
72


