

California's Ocean Economy - California Resources Agency - State ...
California's Ocean Economy - California Resources Agency - State ...
California's Ocean Economy - California Resources Agency - State ...

You also want an ePaper? Increase the reach of your titles
YUMPU automatically turns print PDFs into web optimized ePapers that Google loves.
NOEP<br />
The Transportation sector has the largest employment, wage, and GSP multiplier effects,<br />
while the Minerals sector also has a substantial employment multiplier.<br />
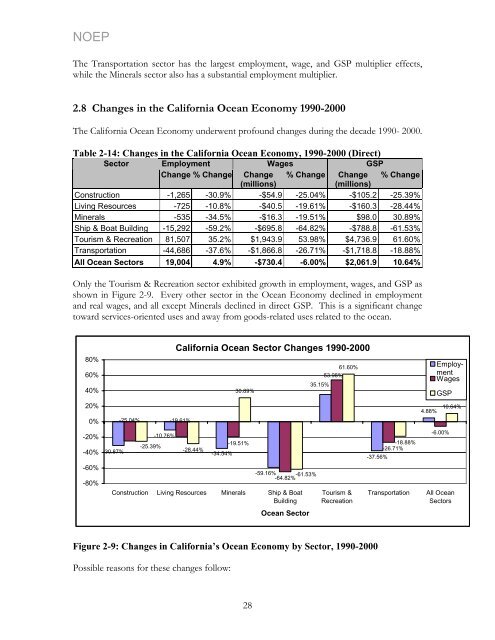
2.8 Changes in the <strong>California</strong> <strong>Ocean</strong> <strong>Economy</strong> 1990-2000<br />
The <strong>California</strong> <strong>Ocean</strong> <strong>Economy</strong> underwent profound changes during the decade 1990- 2000.<br />
Table 2-14: Changes in the <strong>California</strong> <strong>Ocean</strong> <strong>Economy</strong>, 1990-2000 (Direct)<br />
Sector Employment Wages GSP<br />
Change % Change Change % Change Change % Change<br />
(millions)<br />
(millions)<br />
Construction -1,265 -30.9% -$54.9 -25.04% -$105.2 -25.39%<br />
Living <strong>Resources</strong> -725 -10.8% -$40.5 -19.61% -$160.3 -28.44%<br />
Minerals -535 -34.5% -$16.3 -19.51% $98.0 30.89%<br />
Ship & Boat Building -15,292 -59.2% -$695.8 -64.82% -$788.8 -61.53%<br />
Tourism & Recreation 81,507 35.2% $1,943.9 53.98% $4,736.9 61.60%<br />
Transportation -44,686 -37.6% -$1,866.8 -26.71% -$1,718.8 -18.88%<br />
All <strong>Ocean</strong> Sectors 19,004 4.9% -$730.4 -6.00% $2,061.9 10.64%<br />
Only the Tourism & Recreation sector exhibited growth in employment, wages, and GSP as<br />
shown in Figure 2-9. Every other sector in the <strong>Ocean</strong> <strong>Economy</strong> declined in employment<br />
and real wages, and all except Minerals declined in direct GSP. This is a significant change<br />
toward services-oriented uses and away from goods-related uses related to the ocean.<br />
80%<br />
60%<br />
40%<br />
20%<br />
0%<br />
-20%<br />
-40%<br />
-60%<br />
-80%<br />
-30.87%<br />
-25.04% -19.61%<br />
-25.39%<br />
-10.76%<br />
<strong>California</strong> <strong>Ocean</strong> Sector Changes 1990-2000<br />
-28.44%<br />
-34.54%<br />
30.89%<br />
-19.51%<br />
-59.16% -61.53%<br />
-64.82%<br />
Construction Living <strong>Resources</strong> Minerals Ship & Boat<br />
Building<br />
<strong>Ocean</strong> Sector<br />
35.15%<br />
61.60%<br />
53.98%<br />
Tourism &<br />
Recreation<br />
Figure 2-9: Changes in <strong>California</strong>’s <strong>Ocean</strong> <strong>Economy</strong> by Sector, 1990-2000<br />
Possible reasons for these changes follow:<br />
28<br />
-37.56%<br />
-18.88%<br />
-26.71%<br />
4.88%<br />
Employment<br />
Wages<br />
GSP<br />
-6.00%<br />
10.64%<br />
Transportation All <strong>Ocean</strong><br />
Sectors


