

California's Ocean Economy - California Resources Agency - State ...
California's Ocean Economy - California Resources Agency - State ...
California's Ocean Economy - California Resources Agency - State ...

Create successful ePaper yourself
Turn your PDF publications into a flip-book with our unique Google optimized e-Paper software.
NOEP<br />
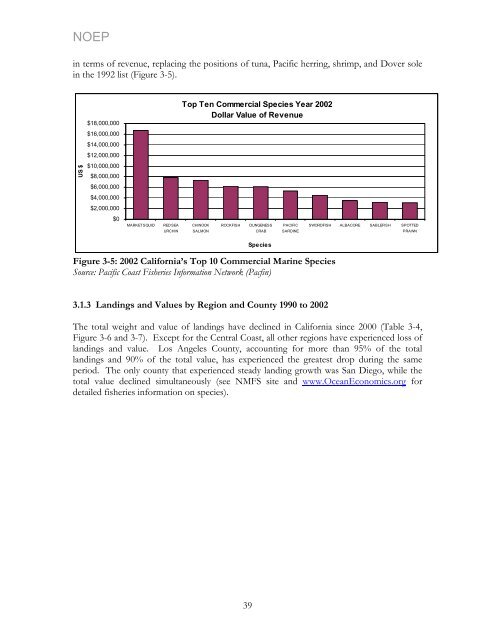
in terms of revenue, replacing the positions of tuna, Pacific herring, shrimp, and Dover sole<br />
in the 1992 list (Figure 3-5).<br />
US $<br />
$18,000,000<br />
$16,000,000<br />
$14,000,000<br />
$12,000,000<br />
$10,000,000<br />
$8,000,000<br />
$6,000,000<br />
$4,000,000<br />
$2,000,000<br />
$0<br />
MARKET SQUID RED SEA<br />
URCHIN<br />
Top Ten Commercial Species Year 2002<br />
Dollar Value of Revenue<br />
CHINOOK<br />
SALMON<br />
ROCKFISH DUNGENESS<br />
CRAB<br />
Species<br />
PACIFIC<br />
SARDINE<br />
Figure 3-5: 2002 <strong>California</strong>’s Top 10 Commercial Marine Species<br />
Source: Pacific Coast Fisheries Information Network (Pacfin)<br />
3.1.3 Landings and Values by Region and County 1990 to 2002<br />
SWORDFISH ALBACORE SABLEFISH SPOTTED<br />
The total weight and value of landings have declined in <strong>California</strong> since 2000 (Table 3-4,<br />
Figure 3-6 and 3-7). Except for the Central Coast, all other regions have experienced loss of<br />
landings and value. Los Angeles County, accounting for more than 95% of the total<br />
landings and 90% of the total value, has experienced the greatest drop during the same<br />
period. The only county that experienced steady landing growth was San Diego, while the<br />
total value declined simultaneously (see NMFS site and www.<strong>Ocean</strong>Economics.org for<br />
detailed fisheries information on species).<br />
39<br />
PRAWN


