

California's Ocean Economy - California Resources Agency - State ...
California's Ocean Economy - California Resources Agency - State ...
California's Ocean Economy - California Resources Agency - State ...

You also want an ePaper? Increase the reach of your titles
YUMPU automatically turns print PDFs into web optimized ePapers that Google loves.
NOEP<br />
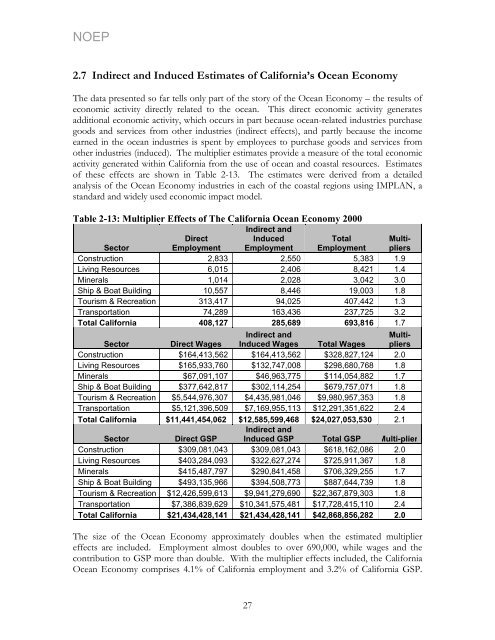
2.7 Indirect and Induced Estimates of <strong>California</strong>’s <strong>Ocean</strong> <strong>Economy</strong><br />
The data presented so far tells only part of the story of the <strong>Ocean</strong> <strong>Economy</strong> – the results of<br />
economic activity directly related to the ocean. This direct economic activity generates<br />
additional economic activity, which occurs in part because ocean-related industries purchase<br />
goods and services from other industries (indirect effects), and partly because the income<br />
earned in the ocean industries is spent by employees to purchase goods and services from<br />
other industries (induced). The multiplier estimates provide a measure of the total economic<br />
activity generated within <strong>California</strong> from the use of ocean and coastal resources. Estimates<br />
of these effects are shown in Table 2-13. The estimates were derived from a detailed<br />
analysis of the <strong>Ocean</strong> <strong>Economy</strong> industries in each of the coastal regions using IMPLAN, a<br />
standard and widely used economic impact model.<br />
Table 2-13: Multiplier Effects of The <strong>California</strong> <strong>Ocean</strong> <strong>Economy</strong> 2000<br />
Indirect and<br />
Direct<br />
Induced<br />
Total Multi-<br />
Sector<br />
Employment Employment Employment pliers<br />
Construction 2,833 2,550 5,383 1.9<br />
Living <strong>Resources</strong> 6,015 2,406 8,421 1.4<br />
Minerals 1,014 2,028 3,042 3.0<br />
Ship & Boat Building 10,557 8,446 19,003 1.8<br />
Tourism & Recreation 313,417 94,025 407,442 1.3<br />
Transportation 74,289 163,436 237,725 3.2<br />
Total <strong>California</strong> 408,127 285,689 693,816 1.7<br />
Indirect and<br />
Multi-<br />
Sector Direct Wages Induced Wages Total Wages pliers<br />
Construction $164,413,562 $164,413,562 $328,827,124 2.0<br />
Living <strong>Resources</strong> $165,933,760 $132,747,008 $298,680,768 1.8<br />
Minerals $67,091,107 $46,963,775 $114,054,882 1.7<br />
Ship & Boat Building $377,642,817 $302,114,254 $679,757,071 1.8<br />
Tourism & Recreation $5,544,976,307 $4,435,981,046 $9,980,957,353 1.8<br />
Transportation $5,121,396,509 $7,169,955,113 $12,291,351,622 2.4<br />
Total <strong>California</strong> $11,441,454,062 $12,585,599,468<br />
Indirect and<br />
$24,027,053,530 2.1<br />
Sector Direct GSP Induced GSP Total GSP Multi-pliers<br />
Construction $309,081,043 $309,081,043 $618,162,086 2.0<br />
Living <strong>Resources</strong> $403,284,093 $322,627,274 $725,911,367 1.8<br />
Minerals $415,487,797 $290,841,458 $706,329,255 1.7<br />
Ship & Boat Building $493,135,966 $394,508,773 $887,644,739 1.8<br />
Tourism & Recreation $12,426,599,613 $9,941,279,690 $22,367,879,303 1.8<br />
Transportation $7,386,839,629 $10,341,575,481 $17,728,415,110 2.4<br />
Total <strong>California</strong> $21,434,428,141 $21,434,428,141 $42,868,856,282 2.0<br />
The size of the <strong>Ocean</strong> <strong>Economy</strong> approximately doubles when the estimated multiplier<br />
effects are included. Employment almost doubles to over 690,000, while wages and the<br />
contribution to GSP more than double. With the multiplier effects included, the <strong>California</strong><br />
<strong>Ocean</strong> <strong>Economy</strong> comprises 4.1% of <strong>California</strong> employment and 3.2% of <strong>California</strong> GSP.<br />
27


