NOEP Table 8-16: Employment, wages and GSP: Coastal Tourism & Recreation Sector Region Employ SIC name 1990 Wages 1990 GSP 1990 North North Central Employ 2000 Wages 2000 GSP 2000 Amusement and Recreation Services 237 $1,904,465 $3,287,060 548 $8,241,712 $13,830,542 Boat Dealers Eating and 17 $278,781 $609,487 D D D Drinking Places Hotels & 2,984 $23,088,454 $50,477,293 4,074 $40,991,235 $93,920,820 Lodging Places 1,466 $13,317,529 $29,141,245 1,936 $23,427,349 $53,140,662 Marinas Recreational D D D D D D Vehicle Parks and D D D D D D Campgrounds Zoos and Aquaria TOURISM & RECREATION Amusement and Recreation Services D D D D D D 4,765 $39,289,773 $84,976,861 6,674 $74,372,905 $164,581,624 7,114 $141,427,734 $244,100,822 9,163 $225,582,798 $378,553,925 Boat Dealers 759 $15,665,485 $34,248,775 363 $10,789,365 $24,721,041 Eating and Drinking Places Hotels and Lodging Places 64,554 $689,685,228 $1,507,829,108 92,365 $1,482,888,549 $3,397,655,840 18,579 $303,401,347 $663,898,905 26,177 $691,246,163 $1,567,965,659 Marinas 233 $4,883,247 $8,011,566 241 $7,443,259 $12,269,584 Recreational Vehicle Parks and Campgrounds Sporting Goods Zoos and Aquaria TOURISM & RECREATION D D D 77 $1,150,123 $2,608,844 191 $4,733,845 $11,333,930 331 $13,156,663 $33,111,139 D D D 454 $10,480,821 $14,791,109 91,623 $1,162,470,431 $2,474,425,311 129,171 $2,442,737,741 $5,431,677,142 120
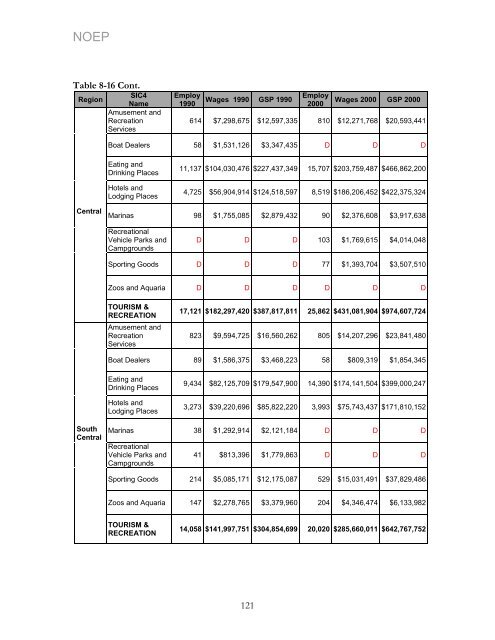
NOEP Table 8-16 Cont. SIC4 Region Name Amusement and Recreation Services Central South Central Employ 1990 Wages 1990 GSP 1990 Employ 2000 Wages 2000 GSP 2000 614 $7,298,675 $12,597,335 810 $12,271,768 $20,593,441 Boat Dealers 58 $1,531,126 $3,347,435 D D D Eating and Drinking Places Hotels and Lodging Places 11,137 $104,030,476 $227,437,349 15,707 $203,759,487 $466,862,200 4,725 $56,904,914 $124,518,597 8,519 $186,206,452 $422,375,324 Marinas 98 $1,755,085 $2,879,432 90 $2,376,608 $3,917,638 Recreational Vehicle Parks and Campgrounds D D D 103 $1,769,615 $4,014,048 Sporting Goods D D D 77 $1,393,704 $3,507,510 Zoos and Aquaria D D D D D D TOURISM & RECREATION Amusement and Recreation Services 17,121 $182,297,420 $387,817,811 25,862 $431,081,904 $974,607,724 823 $9,594,725 $16,560,262 805 $14,207,296 $23,841,480 Boat Dealers 89 $1,586,375 $3,468,223 58 $809,319 $1,854,345 Eating and Drinking Places Hotels and Lodging Places 9,434 $82,125,709 $179,547,900 14,390 $174,141,504 $399,000,247 3,273 $39,220,696 $85,822,220 3,993 $75,743,437 $171,810,152 Marinas 38 $1,292,914 $2,121,184 D D D Recreational Vehicle Parks and Campgrounds 41 $813,396 $1,779,863 D D D Sporting Goods 214 $5,085,171 $12,175,087 529 $15,031,491 $37,829,486 Zoos and Aquaria 147 $2,278,765 $3,379,960 204 $4,346,474 $6,133,982 TOURISM & RECREATION 14,058 $141,997,751 $304,854,699 20,020 $285,660,011 $642,767,752 121
- Page 1 and 2:
NOEP CALIFORNIA’S OCEAN ECONOMY R
- Page 3 and 4:
NOEP Table of Contents Executive Su
- Page 5 and 6:
NOEP PART IV APPENDIX .............
- Page 7 and 8:
NOEP Table 6-4: 2000 Employment, Wa
- Page 9 and 10:
NOEP Figure 8-4: Fishing and Boatin
- Page 11 and 12:
NOEP Executive Summary California
- Page 13 and 14:
NOEP Acknowledgements The State of
- Page 15 and 16:
NOEP PART I BACKGROUND AND SUMMARY
- Page 17 and 18:
NOEP ocean and economic activity, s
- Page 19 and 20:
NOEP The use of SIC codes and geogr
- Page 21 and 22:
NOEP Chapter 2 Summary of Findings
- Page 23 and 24:
NOEP Table 2-2: Regional Population
- Page 25 and 26:
NOEP Table 2-5: Growth Rates for Co
- Page 27 and 28:
NOEP 2.4 California’s Ocean Econo
- Page 29 and 30:
NOEP 2.5 California’s Ocean Econo
- Page 31 and 32:
NOEP Table 2-10: California Ocean E
- Page 33 and 34:
NOEP Figure 2-5 shows that the prop
- Page 35 and 36:
NOEP Number of Workers 1,000,000 10
- Page 37 and 38:
NOEP 2.7 Indirect and Induced Estim
- Page 39 and 40:
NOEP • Construction trends in mar
- Page 41 and 42:
NOEP PART II THE SECTORS OF THE CAL
- Page 43 and 44:
NOEP assess: a) Landings and landed
- Page 45 and 46:
NOEP Billion Pounds 12 10 8 6 4 2 0
- Page 47 and 48:
NOEP Percentage 25% 20% 15% 10% 5%
- Page 49 and 50:
NOEP in terms of revenue, replacing
- Page 51 and 52:
NOEP Figure 3-6 shows the landings
- Page 53 and 54:
NOEP Thousands of Wet Tons 200 180
- Page 55 and 56:
NOEP 3.4 Conclusion Living Resource
- Page 57 and 58:
NOEP Chapter 4 California Ocean Min
- Page 59 and 60:
NOEP Table 4-3: California Offshore
- Page 61 and 62:
NOEP Table 4-6: Coastal Counties On
- Page 63 and 64:
NOEP are concentrated in less than
- Page 65 and 66:
NOEP Chapter 5 California Marine Tr
- Page 67 and 68:
NOEP million tons of foreign cargo
- Page 69 and 70:
NOEP 120,000,000 100,000,000 80,000
- Page 71 and 72:
NOEP From 1992 to 2001, total value
- Page 73 and 74:
NOEP Table 5-4: Port Rankings 2001
- Page 75 and 76:
NOEP 5.2 CA Water Transportation: R
- Page 77 and 78:
NOEP Table 5-9: Warehousing (SIC co
- Page 79 and 80: NOEP Table 5-11: Marine Passenger T
- Page 81 and 82: NOEP Table 5-13: Search and Navigat
- Page 83 and 84: NOEP 5.2 References California Mari
- Page 85 and 86: NOEP Chapter 6 California Marine Co
- Page 87 and 88: NOEP 6.2.1 Historical Capital Expen
- Page 89 and 90: NOEP 60.0% 50.0% 40.0% 30.0% 20.0%
- Page 91 and 92: NOEP CA Share of Total U.S. Port Ca
- Page 93 and 94: NOEP 40 35 30 25 20 15 10 5 0 US Po
- Page 95 and 96: NOEP 6.2.2 Proposed Capital Expendi
- Page 97 and 98: NOEP 2,500 2,000 1,500 1,000 500 0
- Page 99 and 100: NOEP CA Share of Capital Expenditur
- Page 101 and 102: NOEP 6.2.4 Economic Impact The foll
- Page 103 and 104: NOEP 6.3 Beach Nourishment 39 In Ca
- Page 105 and 106: NOEP Table 6-6: Funding for Califor
- Page 107 and 108: NOEP Chapter 7: California Ship & B
- Page 109 and 110: NOEP research ships for commercial
- Page 111 and 112: NOEP 7.3 References CA Employment D
- Page 113 and 114: NOEP Chapter 8 Coastal Tourism & Re
- Page 115 and 116: NOEP volume and diversity, along th
- Page 117 and 118: NOEP participated in marine recreat
- Page 119 and 120: NOEP 8.2.2 California Beach Valuati
- Page 121 and 122: NOEP No attempt has been made to es
- Page 123 and 124: NOEP 8.2.3 Recreational Fishing and
- Page 125 and 126: NOEP 14,000,000 12,000,000 10,000,0
- Page 127 and 128: NOEP The travel industry supported
- Page 129: NOEP 8.4 Regional Estimates of Cali
- Page 133 and 134: NOEP Table 8-17 summarizes the tota
- Page 135 and 136: NOEP 8.5 References California Fast
- Page 137 and 138: NOEP PART III CONCLUSION Future Dir
- Page 139 and 140: NOEP PART IV APPENDIX Appendix A: T
- Page 141 and 142: NOEP All ES-202 data are reported t
- Page 143 and 144: NOEP At the same time, this data se
- Page 145 and 146: NOEP fishing, or boating will not o
- Page 147 and 148: NOEP Table B-1: Commercial Fisherie
- Page 149 and 150: NOEP Appendix C: California Marine
- Page 151 and 152: NOEP Appendix D: California Beaches
- Page 153 and 154: NOEP Table D-1: Regional Beaches an
- Page 155 and 156: NOEP Table D-1: Regional Beaches an
- Page 157 and 158: NOEP Table D-2: Regional Beaches fr
- Page 159 and 160: NOEP Table D-2: Regional Beaches fr
- Page 161 and 162: NOEP Region County Beach Gray Whale
- Page 163 and 164: NOEP Region County Beach San Luis O
- Page 165 and 166: NOEP Region County Beach La Piedra