

California's Ocean Economy - California Resources Agency - State ...
California's Ocean Economy - California Resources Agency - State ...
California's Ocean Economy - California Resources Agency - State ...

Create successful ePaper yourself
Turn your PDF publications into a flip-book with our unique Google optimized e-Paper software.
NOEP<br />
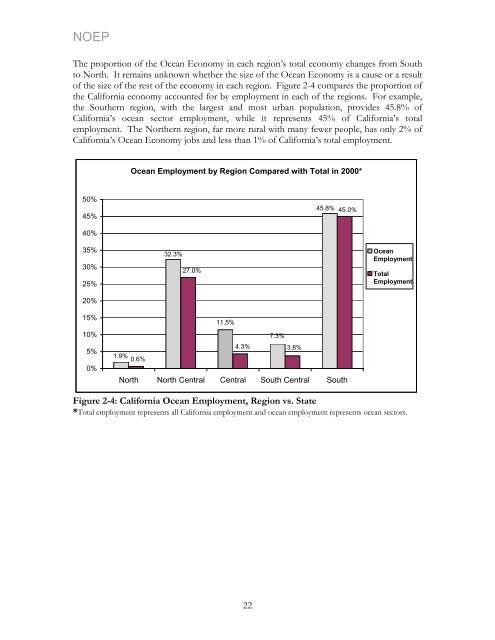
The proportion of the <strong>Ocean</strong> <strong>Economy</strong> in each region’s total economy changes from South<br />
to North. It remains unknown whether the size of the <strong>Ocean</strong> <strong>Economy</strong> is a cause or a result<br />
of the size of the rest of the economy in each region. Figure 2-4 compares the proportion of<br />
the <strong>California</strong> economy accounted for by employment in each of the regions. For example,<br />
the Southern region, with the largest and most urban population, provides 45.8% of<br />
<strong>California</strong>’s ocean sector employment, while it represents 45% of <strong>California</strong>’s total<br />
employment. The Northern region, far more rural with many fewer people, has only 2% of<br />
<strong>California</strong>’s <strong>Ocean</strong> <strong>Economy</strong> jobs and less than 1% of <strong>California</strong>’s total employment.<br />
50%<br />
45%<br />
40%<br />
35%<br />
30%<br />
25%<br />
20%<br />
15%<br />
10%<br />
5%<br />
0%<br />
1.9%<br />
0.6%<br />
<strong>Ocean</strong> Employment by Region Compared with Total in 2000*<br />
32.3%<br />
27.0%<br />
11.5%<br />
7.3%<br />
4.3% 3.8%<br />
45.8%<br />
North North Central Central South Central South<br />
45.0%<br />
<strong>Ocean</strong><br />
Employment<br />
Total<br />
Employment<br />
Figure 2-4: <strong>California</strong> <strong>Ocean</strong> Employment, Region vs. <strong>State</strong><br />
*Total employment represents all <strong>California</strong> employment and ocean employment represents ocean sectors.<br />
22


