

California's Ocean Economy - California Resources Agency - State ...
California's Ocean Economy - California Resources Agency - State ...
California's Ocean Economy - California Resources Agency - State ...

You also want an ePaper? Increase the reach of your titles
YUMPU automatically turns print PDFs into web optimized ePapers that Google loves.
NOEP<br />
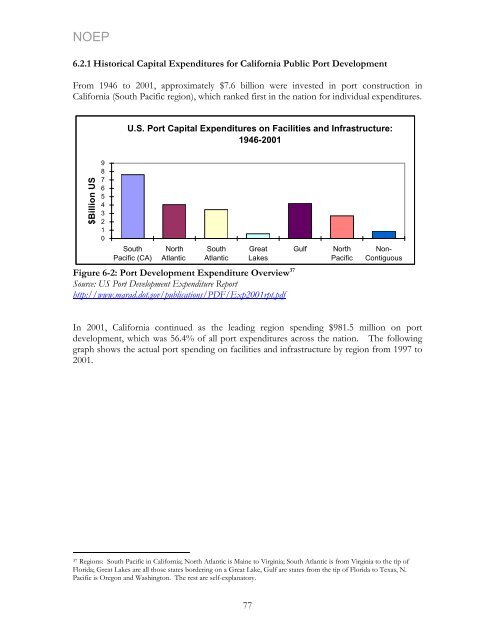
6.2.1 Historical Capital Expenditures for <strong>California</strong> Public Port Development<br />
From 1946 to 2001, approximately $7.6 billion were invested in port construction in<br />
<strong>California</strong> (South Pacific region), which ranked first in the nation for individual expenditures.<br />
$Billion US<br />
9<br />
8<br />
7<br />
6<br />
5<br />
4<br />
3<br />
2<br />
1<br />
0<br />
U.S. Port Capital Expenditures on Facilities and Infrastructure:<br />
1946-2001<br />
South<br />
Pacific (CA)<br />
North<br />
Atlantic<br />
South<br />
Atlantic<br />
Great<br />
Lakes<br />
Figure 6-2: Port Development Expenditure Overview 37<br />
Source: US Port Development Expenditure Report<br />
http://www.marad.dot.gov/publications/PDF/Exp2001rpt.pdf<br />
Gulf North<br />
Pacific<br />
Non-<br />
Contiguous<br />
In 2001, <strong>California</strong> continued as the leading region spending $981.5 million on port<br />
development, which was 56.4% of all port expenditures across the nation. The following<br />
graph shows the actual port spending on facilities and infrastructure by region from 1997 to<br />
2001.<br />
37 Regions: South Pacific in <strong>California</strong>; North Atlantic is Maine to Virginia; South Atlantic is from Virginia to the tip of<br />
Florida; Great Lakes are all those states bordering on a Great Lake, Gulf are states from the tip of Florida to Texas, N.<br />
Pacific is Oregon and Washington. The rest are self-explanatory.<br />
77


