

California's Ocean Economy - California Resources Agency - State ...
California's Ocean Economy - California Resources Agency - State ...
California's Ocean Economy - California Resources Agency - State ...

Create successful ePaper yourself
Turn your PDF publications into a flip-book with our unique Google optimized e-Paper software.
NOEP<br />
60.0%<br />
50.0%<br />
40.0%<br />
30.0%<br />
20.0%<br />
10.0%<br />
0.0%<br />
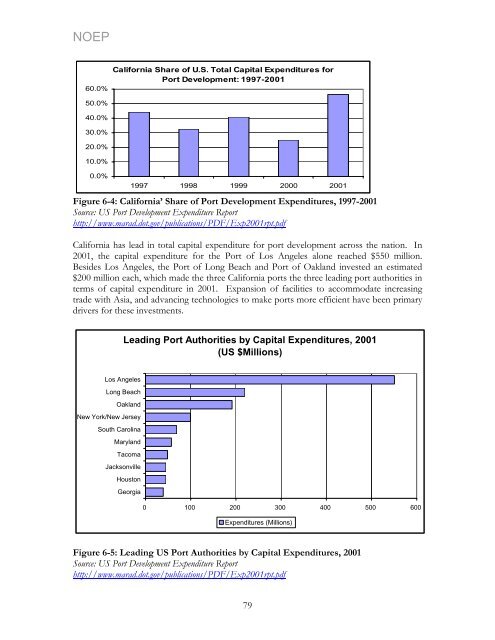
<strong>California</strong> Share of U.S. Total Capital Expenditures for<br />
Port Development: 1997-2001<br />
1997 1998 1999 2000 2001<br />
Figure 6-4: <strong>California</strong>’ Share of Port<br />
Development Expenditures, 1997-2001<br />
Source: US Port Development Expenditure Report<br />
http://www.marad.dot.gov/publications/PDF/Exp2001rpt.pdf<br />
<strong>California</strong> has lead in total capital expenditure for port development across the nation. In<br />
2001, the capital expenditure for the Port of Los Angeles alone reached $550 million.<br />
Besides Los Angeles, the Port of Long Beach and Port of Oakland invested an estimated<br />
$200 million each, which made the three <strong>California</strong> ports the three leading port authorities in<br />
terms of capital expenditure in 2001. Expansion of facilities to accommodate increasing<br />
trade with Asia, and advancing technologies to make ports more efficient have been primary<br />
drivers for these investments.<br />
Los Angeles<br />
Jacksonville<br />
Leading Port Authorities by Capital Expenditures, 2001<br />
(US $Millions)<br />
Long Beach<br />
Oakland<br />
New York/New Jersey<br />
South Carolina<br />
Maryland<br />
Tacoma<br />
Houston<br />
Georgia<br />
0 100 200 300 400 500 600<br />
Expenditures (Millions)<br />
Figure 6-5: Leading US Port Authorities by Capital Expenditures, 2001<br />
Source: US Port Development Expenditure Report<br />
http://www.marad.dot.gov/publications/PDF/Exp2001rpt.pdf<br />
79


