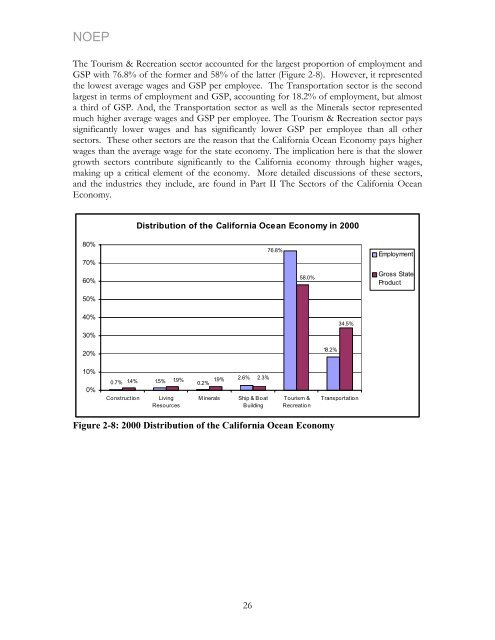
NOEP The Tourism & Recreation sector accounted for the largest proportion of employment and GSP with 76.8% of the former and 58% of the latter (Figure 2-8). However, it represented the lowest average wages and GSP per employee. The Transportation sector is the second largest in terms of employment and GSP, accounting for 18.2% of employment, but almost a third of GSP. And, the Transportation sector as well as the Minerals sector represented much higher average wages and GSP per employee. The Tourism & Recreation sector pays significantly lower wages and has significantly lower GSP per employee than all other sectors. These other sectors are the reason that the <strong>California</strong> <strong>Ocean</strong> <strong>Economy</strong> pays higher wages than the average wage for the state economy. The implication here is that the slower growth sectors contribute significantly to the <strong>California</strong> economy through higher wages, making up a critical element of the economy. More detailed discussions of these sectors, and the industries they include, are found in Part II The Sectors of the <strong>California</strong> <strong>Ocean</strong> <strong>Economy</strong>. 80% 70% 60% 50% 40% 30% 20% 10% 0% Distribution of the <strong>California</strong> <strong>Ocean</strong> <strong>Economy</strong> in 2000 0.7% 1.4% 1.5% 1.9% 1.9% 0.2% Construction Living <strong>Resources</strong> 2.6% 2.3% M inerals Ship & Boat Building 76.8% 58.0% Tourism & Recreation Figure 2-8: 2000 Distribution of the <strong>California</strong> <strong>Ocean</strong> <strong>Economy</strong> 26 18.2% 34.5% Transportation Employment Gross <strong>State</strong> Product
NOEP 2.7 Indirect and Induced Estimates of <strong>California</strong>’s <strong>Ocean</strong> <strong>Economy</strong> The data presented so far tells only part of the story of the <strong>Ocean</strong> <strong>Economy</strong> – the results of economic activity directly related to the ocean. This direct economic activity generates additional economic activity, which occurs in part because ocean-related industries purchase goods and services from other industries (indirect effects), and partly because the income earned in the ocean industries is spent by employees to purchase goods and services from other industries (induced). The multiplier estimates provide a measure of the total economic activity generated within <strong>California</strong> from the use of ocean and coastal resources. Estimates of these effects are shown in Table 2-13. The estimates were derived from a detailed analysis of the <strong>Ocean</strong> <strong>Economy</strong> industries in each of the coastal regions using IMPLAN, a standard and widely used economic impact model. Table 2-13: Multiplier Effects of The <strong>California</strong> <strong>Ocean</strong> <strong>Economy</strong> 2000 Indirect and Direct Induced Total Multi- Sector Employment Employment Employment pliers Construction 2,833 2,550 5,383 1.9 Living <strong>Resources</strong> 6,015 2,406 8,421 1.4 Minerals 1,014 2,028 3,042 3.0 Ship & Boat Building 10,557 8,446 19,003 1.8 Tourism & Recreation 313,417 94,025 407,442 1.3 Transportation 74,289 163,436 237,725 3.2 Total <strong>California</strong> 408,127 285,689 693,816 1.7 Indirect and Multi- Sector Direct Wages Induced Wages Total Wages pliers Construction $164,413,562 $164,413,562 $328,827,124 2.0 Living <strong>Resources</strong> $165,933,760 $132,747,008 $298,680,768 1.8 Minerals $67,091,107 $46,963,775 $114,054,882 1.7 Ship & Boat Building $377,642,817 $302,114,254 $679,757,071 1.8 Tourism & Recreation $5,544,976,307 $4,435,981,046 $9,980,957,353 1.8 Transportation $5,121,396,509 $7,169,955,113 $12,291,351,622 2.4 Total <strong>California</strong> $11,441,454,062 $12,585,599,468 Indirect and $24,027,053,530 2.1 Sector Direct GSP Induced GSP Total GSP Multi-pliers Construction $309,081,043 $309,081,043 $618,162,086 2.0 Living <strong>Resources</strong> $403,284,093 $322,627,274 $725,911,367 1.8 Minerals $415,487,797 $290,841,458 $706,329,255 1.7 Ship & Boat Building $493,135,966 $394,508,773 $887,644,739 1.8 Tourism & Recreation $12,426,599,613 $9,941,279,690 $22,367,879,303 1.8 Transportation $7,386,839,629 $10,341,575,481 $17,728,415,110 2.4 Total <strong>California</strong> $21,434,428,141 $21,434,428,141 $42,868,856,282 2.0 The size of the <strong>Ocean</strong> <strong>Economy</strong> approximately doubles when the estimated multiplier effects are included. Employment almost doubles to over 690,000, while wages and the contribution to GSP more than double. With the multiplier effects included, the <strong>California</strong> <strong>Ocean</strong> <strong>Economy</strong> comprises 4.1% of <strong>California</strong> employment and 3.2% of <strong>California</strong> GSP. 27
- Page 1 and 2: NOEP CALIFORNIA’S OCEAN ECONOMY R
- Page 3 and 4: NOEP Table of Contents Executive Su
- Page 5 and 6: NOEP PART IV APPENDIX .............
- Page 7 and 8: NOEP Table 6-4: 2000 Employment, Wa
- Page 9 and 10: NOEP Figure 8-4: Fishing and Boatin
- Page 11 and 12: NOEP Executive Summary California
- Page 13 and 14: NOEP Acknowledgements The State of
- Page 15 and 16: NOEP PART I BACKGROUND AND SUMMARY
- Page 17 and 18: NOEP ocean and economic activity, s
- Page 19 and 20: NOEP The use of SIC codes and geogr
- Page 21 and 22: NOEP Chapter 2 Summary of Findings
- Page 23 and 24: NOEP Table 2-2: Regional Population
- Page 25 and 26: NOEP Table 2-5: Growth Rates for Co
- Page 27 and 28: NOEP 2.4 California’s Ocean Econo
- Page 29 and 30: NOEP 2.5 California’s Ocean Econo
- Page 31 and 32: NOEP Table 2-10: California Ocean E
- Page 33 and 34: NOEP Figure 2-5 shows that the prop
- Page 35: NOEP Number of Workers 1,000,000 10
- Page 39 and 40: NOEP • Construction trends in mar
- Page 41 and 42: NOEP PART II THE SECTORS OF THE CAL
- Page 43 and 44: NOEP assess: a) Landings and landed
- Page 45 and 46: NOEP Billion Pounds 12 10 8 6 4 2 0
- Page 47 and 48: NOEP Percentage 25% 20% 15% 10% 5%
- Page 49 and 50: NOEP in terms of revenue, replacing
- Page 51 and 52: NOEP Figure 3-6 shows the landings
- Page 53 and 54: NOEP Thousands of Wet Tons 200 180
- Page 55 and 56: NOEP 3.4 Conclusion Living Resource
- Page 57 and 58: NOEP Chapter 4 California Ocean Min
- Page 59 and 60: NOEP Table 4-3: California Offshore
- Page 61 and 62: NOEP Table 4-6: Coastal Counties On
- Page 63 and 64: NOEP are concentrated in less than
- Page 65 and 66: NOEP Chapter 5 California Marine Tr
- Page 67 and 68: NOEP million tons of foreign cargo
- Page 69 and 70: NOEP 120,000,000 100,000,000 80,000
- Page 71 and 72: NOEP From 1992 to 2001, total value
- Page 73 and 74: NOEP Table 5-4: Port Rankings 2001
- Page 75 and 76: NOEP 5.2 CA Water Transportation: R
- Page 77 and 78: NOEP Table 5-9: Warehousing (SIC co
- Page 79 and 80: NOEP Table 5-11: Marine Passenger T
- Page 81 and 82: NOEP Table 5-13: Search and Navigat
- Page 83 and 84: NOEP 5.2 References California Mari
- Page 85 and 86: NOEP Chapter 6 California Marine Co
- Page 87 and 88:
NOEP 6.2.1 Historical Capital Expen
- Page 89 and 90:
NOEP 60.0% 50.0% 40.0% 30.0% 20.0%
- Page 91 and 92:
NOEP CA Share of Total U.S. Port Ca
- Page 93 and 94:
NOEP 40 35 30 25 20 15 10 5 0 US Po
- Page 95 and 96:
NOEP 6.2.2 Proposed Capital Expendi
- Page 97 and 98:
NOEP 2,500 2,000 1,500 1,000 500 0
- Page 99 and 100:
NOEP CA Share of Capital Expenditur
- Page 101 and 102:
NOEP 6.2.4 Economic Impact The foll
- Page 103 and 104:
NOEP 6.3 Beach Nourishment 39 In Ca
- Page 105 and 106:
NOEP Table 6-6: Funding for Califor
- Page 107 and 108:
NOEP Chapter 7: California Ship & B
- Page 109 and 110:
NOEP research ships for commercial
- Page 111 and 112:
NOEP 7.3 References CA Employment D
- Page 113 and 114:
NOEP Chapter 8 Coastal Tourism & Re
- Page 115 and 116:
NOEP volume and diversity, along th
- Page 117 and 118:
NOEP participated in marine recreat
- Page 119 and 120:
NOEP 8.2.2 California Beach Valuati
- Page 121 and 122:
NOEP No attempt has been made to es
- Page 123 and 124:
NOEP 8.2.3 Recreational Fishing and
- Page 125 and 126:
NOEP 14,000,000 12,000,000 10,000,0
- Page 127 and 128:
NOEP The travel industry supported
- Page 129 and 130:
NOEP 8.4 Regional Estimates of Cali
- Page 131 and 132:
NOEP Table 8-16 Cont. SIC4 Region N
- Page 133 and 134:
NOEP Table 8-17 summarizes the tota
- Page 135 and 136:
NOEP 8.5 References California Fast
- Page 137 and 138:
NOEP PART III CONCLUSION Future Dir
- Page 139 and 140:
NOEP PART IV APPENDIX Appendix A: T
- Page 141 and 142:
NOEP All ES-202 data are reported t
- Page 143 and 144:
NOEP At the same time, this data se
- Page 145 and 146:
NOEP fishing, or boating will not o
- Page 147 and 148:
NOEP Table B-1: Commercial Fisherie
- Page 149 and 150:
NOEP Appendix C: California Marine
- Page 151 and 152:
NOEP Appendix D: California Beaches
- Page 153 and 154:
NOEP Table D-1: Regional Beaches an
- Page 155 and 156:
NOEP Table D-1: Regional Beaches an
- Page 157 and 158:
NOEP Table D-2: Regional Beaches fr
- Page 159 and 160:
NOEP Table D-2: Regional Beaches fr
- Page 161 and 162:
NOEP Region County Beach Gray Whale
- Page 163 and 164:
NOEP Region County Beach San Luis O
- Page 165 and 166:
NOEP Region County Beach La Piedra