

California's Ocean Economy - California Resources Agency - State ...
California's Ocean Economy - California Resources Agency - State ...
California's Ocean Economy - California Resources Agency - State ...

Create successful ePaper yourself
Turn your PDF publications into a flip-book with our unique Google optimized e-Paper software.
NOEP<br />
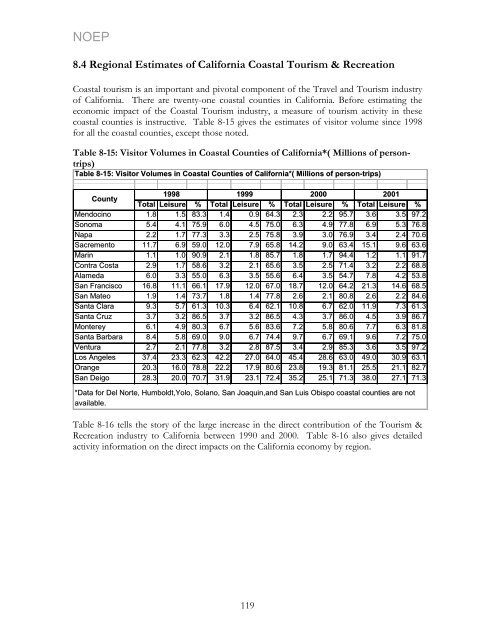
8.4 Regional Estimates of <strong>California</strong> Coastal Tourism & Recreation<br />
Coastal tourism is an important and pivotal component of the Travel and Tourism industry<br />
of <strong>California</strong>. There are twenty-one coastal counties in <strong>California</strong>. Before estimating the<br />
economic impact of the Coastal Tourism industry, a measure of tourism activity in these<br />
coastal counties is instructive. Table 8-15 gives the estimates of visitor volume since 1998<br />
for all the coastal counties, except those noted.<br />
Table 8-15: Visitor Volumes in Coastal Counties of <strong>California</strong>*( Millions of persontrips)<br />
Table 8-15: Visitor Volumes in Coastal Counties of <strong>California</strong>*( Millions of person-trips)<br />
County<br />
1998<br />
Total Leisure %<br />
1999<br />
Total Leisure %<br />
2000<br />
Total Leisure<br />
2001<br />
% Total Leisure %<br />
Mendocino 1.8 1.5 83.3 1.4 0.9 64.3 2.3 2.2 95.7 3.6 3.5 97.2<br />
Sonoma 5.4 4.1 75.9 6.0 4.5 75.0 6.3 4.9 77.8 6.9 5.3 76.8<br />
Napa 2.2 1.7 77.3 3.3 2.5 75.8 3.9 3.0 76.9 3.4 2.4 70.6<br />
Sacremento 11.7 6.9 59.0 12.0 7.9 65.8 14.2 9.0 63.4 15.1 9.6 63.6<br />
Marin 1.1 1.0 90.9 2.1 1.8 85.7 1.8 1.7 94.4 1.2 1.1 91.7<br />
Contra Costa 2.9 1.7 58.6 3.2 2.1 65.6 3.5 2.5 71.4 3.2 2.2 68.8<br />
Alameda 6.0 3.3 55.0 6.3 3.5 55.6 6.4 3.5 54.7 7.8 4.2 53.8<br />
San Francisco 16.8 11.1 66.1 17.9 12.0 67.0 18.7 12.0 64.2 21.3 14.6 68.5<br />
San Mateo 1.9 1.4 73.7 1.8 1.4 77.8 2.6 2.1 80.8 2.6 2.2 84.6<br />
Santa Clara 9.3 5.7 61.3 10.3 6.4 62.1 10.8 6.7 62.0 11.9 7.3 61.3<br />
Santa Cruz 3.7 3.2 86.5 3.7 3.2 86.5 4.3 3.7 86.0 4.5 3.9 86.7<br />
Monterey 6.1 4.9 80.3 6.7 5.6 83.6 7.2 5.8 80.6 7.7 6.3 81.8<br />
Santa Barbara 8.4 5.8 69.0 9.0 6.7 74.4 9.7 6.7 69.1 9.6 7.2 75.0<br />
Ventura 2.7 2.1 77.8 3.2 2.8 87.5 3.4 2.9 85.3 3.6 3.5 97.2<br />
Los Angeles 37.4 23.3 62.3 42.2 27.0 64.0 45.4 28.6 63.0 49.0 30.9 63.1<br />
Orange 20.3 16.0 78.8 22.2 17.9 80.6 23.8 19.3 81.1 25.5 21.1 82.7<br />
San Deigo 28.3 20.0 70.7 31.9 23.1 72.4 35.2 25.1 71.3 38.0 27.1 71.3<br />
*Data for Del Norte, Humboldt,Yolo, Solano, San Joaquin,and San Luis Obispo coastal counties are not<br />
available.<br />
Table 8-16 tells the story of the large increase in the direct contribution of the Tourism &<br />
Recreation industry to <strong>California</strong> between 1990 and 2000. Table 8-16 also gives detailed<br />
activity information on the direct impacts on the <strong>California</strong> economy by region.<br />
119


