

California's Ocean Economy - California Resources Agency - State ...
California's Ocean Economy - California Resources Agency - State ...
California's Ocean Economy - California Resources Agency - State ...

Create successful ePaper yourself
Turn your PDF publications into a flip-book with our unique Google optimized e-Paper software.
NOEP<br />
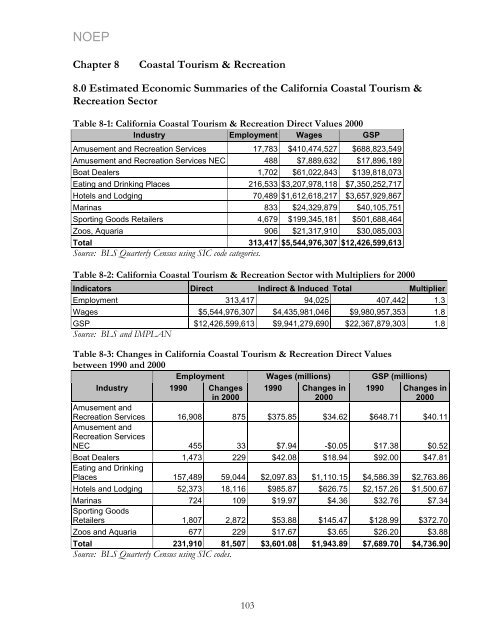
Chapter 8 Coastal Tourism & Recreation<br />
8.0 Estimated Economic Summaries of the <strong>California</strong> Coastal Tourism &<br />
Recreation Sector<br />
Table 8-1: <strong>California</strong> Coastal Tourism & Recreation Direct Values 2000<br />
Industry Employment Wages GSP<br />
Amusement and Recreation Services 17,783 $410,474,527 $688,823,549<br />
Amusement and Recreation Services NEC 488 $7,889,632 $17,896,189<br />
Boat Dealers 1,702 $61,022,843 $139,818,073<br />
Eating and Drinking Places 216,533 $3,207,978,118 $7,350,252,717<br />
Hotels and Lodging 70,489 $1,612,618,217 $3,657,929,867<br />
Marinas 833 $24,329,879 $40,105,751<br />
Sporting Goods Retailers 4,679 $199,345,181 $501,688,464<br />
Zoos, Aquaria 906 $21,317,910 $30,085,003<br />
Total 313,417 $5,544,976,307 $12,426,599,613<br />
Source: BLS Quarterly Census using SIC code categories.<br />
Table 8-2: <strong>California</strong> Coastal Tourism & Recreation Sector with Multipliers for 2000<br />
Indicators Direct Indirect & Induced Total Multiplier<br />
Employment 313,417 94,025 407,442 1.3<br />
Wages $5,544,976,307 $4,435,981,046 $9,980,957,353 1.8<br />
GSP $12,426,599,613 $9,941,279,690 $22,367,879,303 1.8<br />
Source: BLS and IMPLAN<br />
Table 8-3: Changes in <strong>California</strong> Coastal Tourism & Recreation Direct Values<br />
between 1990 and 2000<br />
Employment Wages (millions) GSP (millions)<br />
Industry 1990 Changes 1990 Changes in 1990 Changes in<br />
Amusement and<br />
in 2000<br />
2000<br />
2000<br />
Recreation Services<br />
Amusement and<br />
Recreation Services<br />
16,908 875 $375.85 $34.62 $648.71 $40.11<br />
NEC 455 33 $7.94 -$0.05 $17.38 $0.52<br />
Boat Dealers<br />
Eating and Drinking<br />
1,473 229 $42.08 $18.94 $92.00 $47.81<br />
Places 157,489 59,044 $2,097.83 $1,110.15 $4,586.39 $2,763.86<br />
Hotels and Lodging 52,373 18,116 $985.87 $626.75 $2,157.26 $1,500.67<br />
Marinas<br />
Sporting Goods<br />
724 109 $19.97 $4.36 $32.76 $7.34<br />
Retailers 1,807 2,872 $53.88 $145.47 $128.99 $372.70<br />
Zoos and Aquaria 677 229 $17.67 $3.65 $26.20 $3.88<br />
Total 231,910 81,507 $3,601.08 $1,943.89 $7,689.70 $4,736.90<br />
Source: BLS Quarterly Census using SIC codes.<br />
103


