California's Ocean Economy - California Resources Agency - State ...
California's Ocean Economy - California Resources Agency - State ...
California's Ocean Economy - California Resources Agency - State ...
You also want an ePaper? Increase the reach of your titles
YUMPU automatically turns print PDFs into web optimized ePapers that Google loves.
NOEP<br />
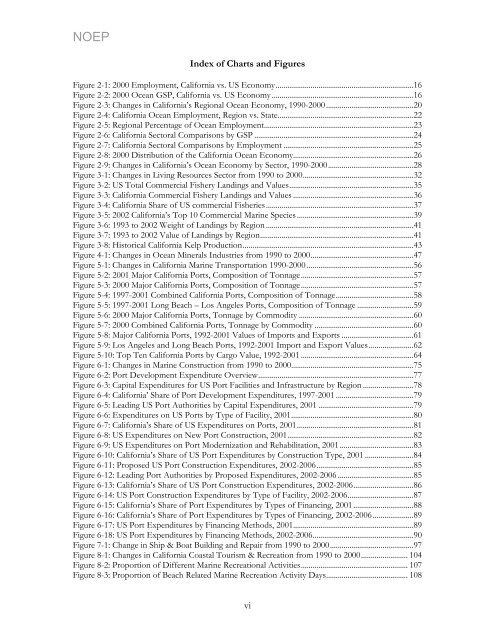
Index of Charts and Figures<br />
Figure 2-1: 2000 Employment, <strong>California</strong> vs. US <strong>Economy</strong>.......................................................................16<br />
Figure 2-2: 2000 <strong>Ocean</strong> GSP, <strong>California</strong> vs. US <strong>Economy</strong> .........................................................................16<br />
Figure 2-3: Changes in <strong>California</strong>’s Regional <strong>Ocean</strong> <strong>Economy</strong>, 1990-2000 .............................................20<br />
Figure 2-4: <strong>California</strong> <strong>Ocean</strong> Employment, Region vs. <strong>State</strong>......................................................................22<br />
Figure 2-5: Regional Percentage of <strong>Ocean</strong> Employment.............................................................................23<br />
Figure 2-6: <strong>California</strong> Sectoral Comparisons by GSP ..................................................................................24<br />
Figure 2-7: <strong>California</strong> Sectoral Comparisons by Employment ...................................................................25<br />
Figure 2-8: 2000 Distribution of the <strong>California</strong> <strong>Ocean</strong> <strong>Economy</strong>..............................................................26<br />
Figure 2-9: Changes in <strong>California</strong>’s <strong>Ocean</strong> <strong>Economy</strong> by Sector, 1990-2000............................................28<br />
Figure 3-1: Changes in Living <strong>Resources</strong> Sector from 1990 to 2000.........................................................32<br />
Figure 3-2: US Total Commercial Fishery Landings and Values................................................................35<br />
Figure 3-3: <strong>California</strong> Commercial Fishery Landings and Values ..............................................................36<br />
Figure 3-4: <strong>California</strong> Share of US commercial Fisheries............................................................................37<br />
Figure 3-5: 2002 <strong>California</strong>’s Top 10 Commercial Marine Species ............................................................39<br />
Figure 3-6: 1993 to 2002 Weight of Landings by Region ............................................................................41<br />
Figure 3-7: 1993 to 2002 Value of Landings by Region...............................................................................41<br />
Figure 3-8: Historical <strong>California</strong> Kelp Production........................................................................................43<br />
Figure 4-1: Changes in <strong>Ocean</strong> Minerals Industries from 1990 to 2000.....................................................47<br />
Figure 5-1: Changes in <strong>California</strong> Marine Transportation 1990-2000 .......................................................56<br />
Figure 5-2: 2001 Major <strong>California</strong> Ports, Composition of Tonnage..........................................................57<br />
Figure 5-3: 2000 Major <strong>California</strong> Ports, Composition of Tonnage..........................................................57<br />
Figure 5-4: 1997-2001 Combined <strong>California</strong> Ports, Composition of Tonnage........................................58<br />
Figure 5-5: 1997-2001 Long Beach – Los Angeles Ports, Composition of Tonnage .............................59<br />
Figure 5-6: 2000 Major <strong>California</strong> Ports, Tonnage by Commodity ...........................................................60<br />
Figure 5-7: 2000 Combined <strong>California</strong> Ports, Tonnage by Commodity ...................................................60<br />
Figure 5-8: Major <strong>California</strong> Ports, 1992-2001 Values of Imports and Exports .....................................61<br />
Figure 5-9: Los Angeles and Long Beach Ports, 1992-2001 Import and Export Values.......................62<br />
Figure 5-10: Top Ten <strong>California</strong> Ports by Cargo Value, 1992-2001 ..........................................................64<br />
Figure 6-1: Changes in Marine Construction from 1990 to 2000...............................................................75<br />
Figure 6-2: Port Development Expenditure Overview................................................................................77<br />
Figure 6-3: Capital Expenditures for US Port Facilities and Infrastructure by Region ..........................78<br />
Figure 6-4: <strong>California</strong>’ Share of Port Development Expenditures, 1997-2001 ........................................79<br />
Figure 6-5: Leading US Port Authorities by Capital Expenditures, 2001 .................................................79<br />
Figure 6-6: Expenditures on US Ports by Type of Facility, 2001...............................................................80<br />
Figure 6-7: <strong>California</strong>’s Share of US Expenditures on Ports, 2001............................................................81<br />
Figure 6-8: US Expenditures on New Port Construction, 2001.................................................................82<br />
Figure 6-9: US Expenditures on Port Modernization and Rehabilitation, 2001......................................83<br />
Figure 6-10: <strong>California</strong>’s Share of US Port Expenditures by Construction Type, 2001 .........................84<br />
Figure 6-11: Proposed US Port Construction Expenditures, 2002-2006..................................................85<br />
Figure 6-12: Leading Port Authorities by Proposed Expenditures, 2002-2006 .......................................85<br />
Figure 6-13: <strong>California</strong>’s Share of US Port Construction Expenditures, 2002-2006...............................86<br />
Figure 6-14: US Port Construction Expenditures by Type of Facility, 2002-2006..................................87<br />
Figure 6-15: <strong>California</strong>’s Share of Port Expenditures by Types of Financing, 2001...............................88<br />
Figure 6-16: <strong>California</strong>’s Share of Port Expenditures by Types of Financing, 2002-2006.....................89<br />
Figure 6-17: US Port Expenditures by Financing Methods, 2001..............................................................89<br />
Figure 6-18: US Port Expenditures by Financing Methods, 2002-2006....................................................90<br />
Figure 7-1: Change in Ship & Boat Building and Repair from 1990 to 2000...........................................97<br />
Figure 8-1: Changes in <strong>California</strong> Coastal Tourism & Recreation from 1990 to 2000........................ 104<br />
Figure 8-2: Proportion of Different Marine Recreational Activities....................................................... 107<br />
Figure 8-3: Proportion of Beach Related Marine Recreation Activity Days.......................................... 108<br />
vi


