

California's Ocean Economy - California Resources Agency - State ...
California's Ocean Economy - California Resources Agency - State ...
California's Ocean Economy - California Resources Agency - State ...

You also want an ePaper? Increase the reach of your titles
YUMPU automatically turns print PDFs into web optimized ePapers that Google loves.
NOEP<br />
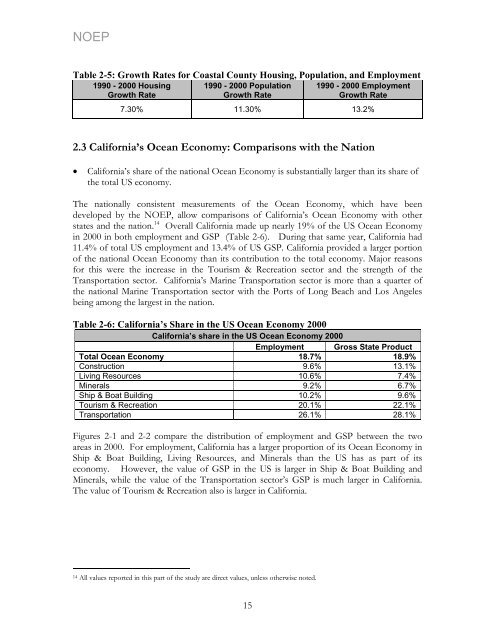
Table 2-5: Growth Rates for Coastal County Housing, Population, and Employment<br />
1990 - 2000 Housing<br />
Growth Rate<br />
1990 - 2000 Population<br />
Growth Rate<br />
1990 - 2000 Employment<br />
Growth Rate<br />
7.30% 11.30% 13.2%<br />
2.3 <strong>California</strong>’s <strong>Ocean</strong> <strong>Economy</strong>: Comparisons with the Nation<br />
• <strong>California</strong>’s share of the national <strong>Ocean</strong> <strong>Economy</strong> is substantially larger than its share of<br />
the total US economy.<br />
The nationally consistent measurements of the <strong>Ocean</strong> <strong>Economy</strong>, which have been<br />
developed by the NOEP, allow comparisons of <strong>California</strong>’s <strong>Ocean</strong> <strong>Economy</strong> with other<br />
states and the nation. 14 Overall <strong>California</strong> made up nearly 19% of the US <strong>Ocean</strong> <strong>Economy</strong><br />
in 2000 in both employment and GSP (Table 2-6). During that same year, <strong>California</strong> had<br />
11.4% of total US employment and 13.4% of US GSP. <strong>California</strong> provided a larger portion<br />
of the national <strong>Ocean</strong> <strong>Economy</strong> than its contribution to the total economy. Major reasons<br />
for this were the increase in the Tourism & Recreation sector and the strength of the<br />
Transportation sector. <strong>California</strong>’s Marine Transportation sector is more than a quarter of<br />
the national Marine Transportation sector with the Ports of Long Beach and Los Angeles<br />
being among the largest in the nation.<br />
Table 2-6: <strong>California</strong>’s Share in the US <strong>Ocean</strong> <strong>Economy</strong> 2000<br />
<strong>California</strong>’s share in the US <strong>Ocean</strong> <strong>Economy</strong> 2000<br />
Employment Gross <strong>State</strong> Product<br />
Total <strong>Ocean</strong> <strong>Economy</strong> 18.7% 18.9%<br />
Construction 9.6% 13.1%<br />
Living <strong>Resources</strong> 10.6% 7.4%<br />
Minerals 9.2% 6.7%<br />
Ship & Boat Building 10.2% 9.6%<br />
Tourism & Recreation 20.1% 22.1%<br />
Transportation 26.1% 28.1%<br />
Figures 2-1 and 2-2 compare the distribution of employment and GSP between the two<br />
areas in 2000. For employment, <strong>California</strong> has a larger proportion of its <strong>Ocean</strong> <strong>Economy</strong> in<br />
Ship & Boat Building, Living <strong>Resources</strong>, and Minerals than the US has as part of its<br />
economy. However, the value of GSP in the US is larger in Ship & Boat Building and<br />
Minerals, while the value of the Transportation sector’s GSP is much larger in <strong>California</strong>.<br />
The value of Tourism & Recreation also is larger in <strong>California</strong>.<br />
14 All values reported in this part of the study are direct values, unless otherwise noted.<br />
15


